Download: project.ela
File Includes:
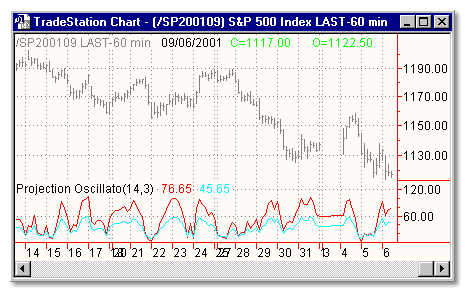
Indicator - Projection Oscillator
Indicator - Proj Bandwith
Indicator - Upper/Lower Pro Band
Category: Indicator > Oscillators
Description:
Projection bands, a new method using trading bands, projects market data forward along the data trend with the maxima and minima of the projections defining the band. The method provides another means of signaling potential changes for market direction relative to the trend.
This is the second component of this method, the Projection Oscillator indicator. In fact, the projection oscillator might be thought of as being analogous to the stochastics indicator with a trend correction.
This indicator is calculated according to the next formula:
Actually this indicator plots 2 indicators: Projection Oscillator itself and smoothed Projection Oscillator, which is simply the n day exponential moving average (EMA) of Projection oscillator
Usage:
Inputs:
Length - number of bars to calculate Projection Oscillator
Smooth - number of bars to calculate Smoothed Projection Oscillator
EasyLanguage Code:
INPUTS: LENGTH(14), SMOOTH(3);

VARS:    SL(0), SH(0), PL(0), PU(0), PO(0), SLOWPO(0);


SL=LINEARREGSLOPE(LOW,LENGTH);

SH=LINEARREGSLOPE(HIGH,LENGTH);


FOR VALUE1=1 TO LENGTH BEGIN

    VALUE2=LOW[VALUE1-1] +(SL*VALUE1-1);

    VALUE3=HIGH[VALUE1-1]+(SH*VALUE1-1);

    IF VALUE1=1 THEN BEGIN

         PL=VALUE2;

         PU=VALUE3;

    END;

    IF VALUE2THEN PL=VALUE2;

    IF VALUE3>PU THEN PU=VALUE3;

END;


PO=100*(CLOSE-PL)/(PU-PL);


SLOWPO=SLOWPO[1]+(2/(SMOOTH+1))*(PO-PO[1]);

IF CURRENTBAR=1 THEN SLOWPO=PO;


PLOT1(PO,"PO");

PLOT2(SLOWPO,"SLOWPO");


{COPYRIGHT C 1997, TECHNICAL ANALYSIS, INC.}