To begin with, here's a list of topics we'll try to encompass. In our quest to cover every aspect of eSignal BackTesting both for beginners and for experienced users we might, being only human, miss some points - but hopefully a discussion joined by all willing customers could fill the gaps, then. So, the contents:
Some words on the eSignal Formula Script language
How to use the features of BackTesting in eSignal
What is a trading system and what is it for
Programming your first EFS trading system
A simple EFS-based trading system
The structure of a simple trading system
Language syntax
Debugging the code
Analysis of a trading system with the eSignal Strategy Analyzer
EFS backtesting samples
Some words on the eSignal Formula Script language
eSignal's Advanced Charts and EFS are features offered to the customers quite recently, the features that took eSignal to the new level of quality and made it without doubt the most promising trading platform around. Now eSignal has all the prerequisites - best data quality, cutting edge technologies and extensive customer support.
So what does the eSignal Formula Script enable us to do? When you want to develop your own custom trading signals or write your own analysis techniques you'll be using the EFS. For comparison we can think of it in parallel with the TradeStation EasyLanguage. Inside an EFS file you'll find the code that powers the indicator, using the same principle as in EasyLanguage: the formula programmed in EFS is calculated for every bar, and the values passed to Return are displayed on the chart. But the structure of the EFS language differs from EasyLanguage. If you have experience in programming, I can say for example that EFS and EasyLanguage are as different as Delphi and Visual C++. Delphi is simpler and more user friendly. A simple program in Delphi can be written by clicking a couple of nice-looking buttons, but Delphi lacks the power, speed and logic of C++ or for that matter EFS. Besides, EFS is really new and there isn't enough information and ready examples to make life easier for new users. After a while EFS will become no less convenient than EasyLanguage, at the same time providing much more features and flexibility. I have to remark that now the EFS functions culture isn't deeply developed. As a rule looking into a EFS file you'll see the whole code for the indicator. But as time passes the approach to EFS programming will surely become more structured. For a closer view at the EFS syntax use this link.
We're not going deep in those details now, since our principal goal is learning the features of BackTesting and learning to program trading systems in EFS ourselves.
How to use the features of BackTesting in eSignal
The usage of BackTesting in eSignal is really simple although to some its application may look not tool logical. Here we'll review a purely technical aspect of using BackTesting and then move over to examples of trading system building as such.
So, first of all you must download and install eSignal version 7.1 or newer. The installation files can be found at http://www.esignal.com/download/default.asp.
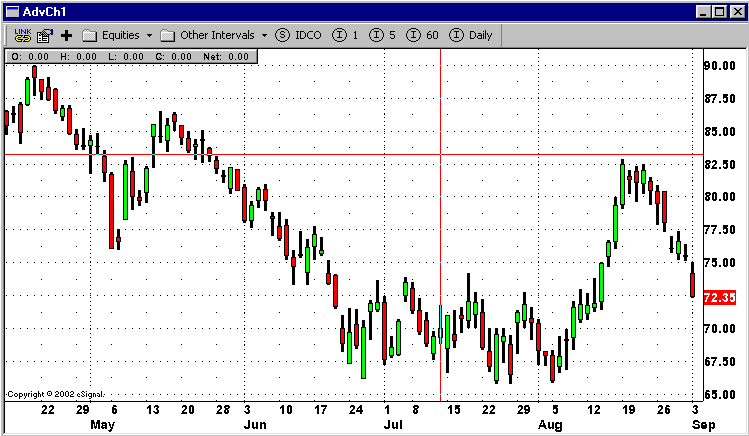
If your installation was successful, you can launch eSignal and plot an Advanced Chart (File > New > Advanced Chart). This is what I received when plotting daily IBM data:
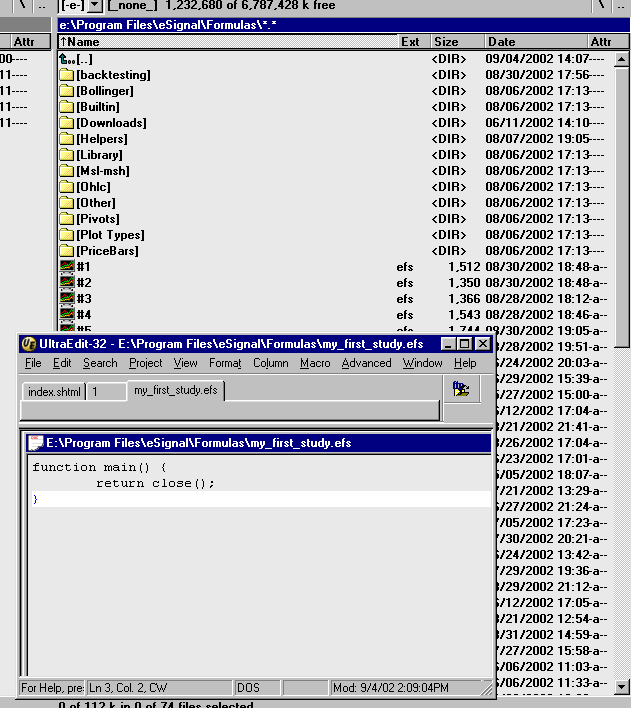
Now we're able to apply different EFS studies to this chart. To do it you must have the EFS study you intend to use in the same directory as eSignal, in the Formulas folder. So I created, using a simple text editor, a file in the Formulas folder, called my_first_study.efs and containing some uncomplicated code:
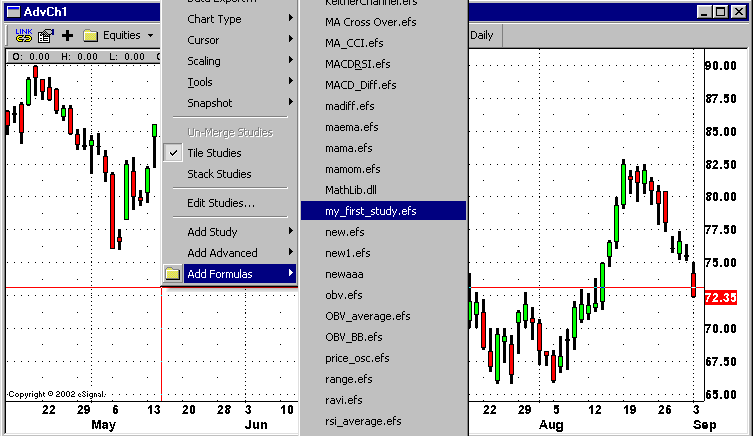
Now our first EFS study is ready to be applied to the chart. Right-click on the chart, choose Add Formulas and find my_first_study.efs.
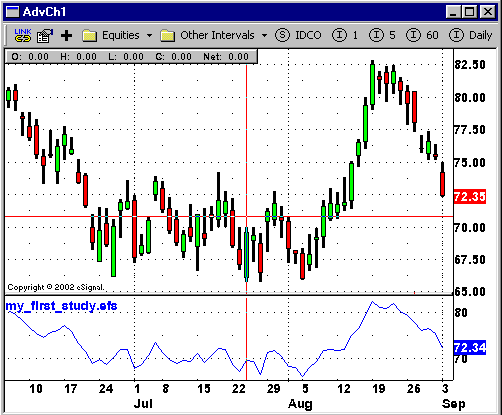
It's done - on the chart we can see a line built on the bars' close price.
I think up to here nobody has questions so far - and to see more features of Advanced Chart, follow the link to the eSignal site.
To use the BackTesting feature you must follow the same steps, just instead of Add Formulas you must select Back Test... A window will appear, looking like this:
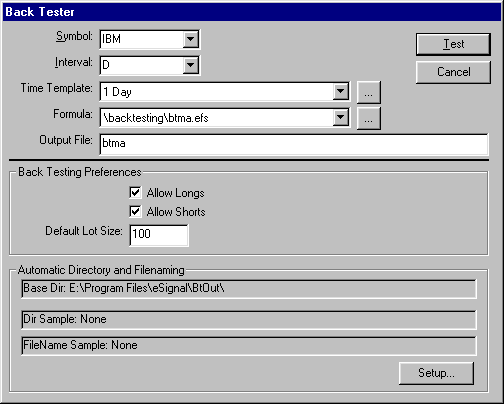
In this window we're most interested in the formula field. Here you must choose your EFS study pre-programmed with trading signals. We'll discuss programming it later - here I must stress to you that first of all, BackTesting studies, just like common studies, must be kept in the Formulas folder. But since BackTesting studies differ by containing trading signals (i.e. functions telling your system where to buy and sell), I'd recommend you to keep BackTesting studies in a separate folder to avoid mixing them up. i myself store them in a subfolder Formulas > Backtesting. Okay, after selecting the proper Study in the Formula field, click Test and... later. First let's write our first trading system in EFS.
What is a trading system and what is it for
A trading system is a set of definite rules for selling and buying the trader strictly follows. One can be sure of one thing only - a trader who trades with discretion, is not a real one. By developing and testing your own system you'll become better prepared to face the inevitable periods of losses.
A system approach to trading is an inseparable part of trading as a profession.Naturally, every professional trader has a personal trading approach, personal preferences and an own view of risk/profit. Some prefer daytrading using classic trend following approaches, some like intraday trading with numerous short trades. For some a loss of 15% from initial capital is not a problem at all, for some this kind of luxury is out of all question.
All we can do is offer a minimal set of rules to base your trading system on. Then it will be up to you to decide what exactly do you wish to figure in your personal trading plan. The main task of this article is to make users familiar with technical side of BackTesting, but it seemed to us that not including real-life approaches just won't do it an a complete way.
We are not able to give your a definite advice: this system is good, that is bad. Only you know what to do to make yourself feel content with you trading and obtain good results. So try answering the following questions:
Do I prefer to follow every movement of the market or to trade long periods?
What part of my capital can I afford to lose if the market goes against me?
How much time can I devote to trading?
The opinion you form will help you in choosing the trading approach to use.
Then you should select liquid, tradable markets, define the tools you'll be using for technical analysis, to set rules for entering and exiting the market, to correctly define and set stop loss and profit targets.
Unluckily, the format of this article does not allow us to cover all those topics in detail, but we'll be glad to discuss any topics you bring up. So far we assume you have made your choices on what and how to trade and now we can proceed to the problem of technical implementation of your trading method in EFS.
Programming your first EFS trading system
A simple EFS-based trading system
The time has come to write our first EFS trading system. There isn't a better suited example then a moving average crossover strategy. This is the almost the simplest strategy a trader can imagine. It is based on the moving average concept. A Moving Average is an indicator that shows the average value of a security's price over a period of time. When calculating a moving average, a mathematical analysis of the security's average value over a predetermined time period is made. As the security's price changes, its average price moves up or down. We enter a Long position if the moving average crosses the price downwards and a Short, if the moving average crosses the price upwards.
So, let's create a file in the Formulas > BackTesting, call it my_first_strategy.efs and paste to it the following code:
var study = new MAStudy(40, 0, "Close", MAStudy.SIMPLE);


function preMain() {

	setPriceStudy(true);

	setColorPriceBars(true);

	setDefaultPriceBarColor(Color.black);

	}


function main() {

	var v = study.getValue(MAStudy.MA);

	if(v == null)

		return;

	if(close() >= v && !Strategy.isLong())

		Strategy.doLong("Crossing Up", Strategy.MARKET, Strategy.THISBAR);

	if(close() < v && !Strategy.isShort())

		Strategy.doShort("Crossing Down", Strategy.MARKET, Strategy.THISBAR);

	if(Strategy.isLong())

		setPriceBarColor(Color.lime);

	else if(Strategy.isShort())

		setPriceBarColor(Color.red);

	return v;

}
Now enter the program, right-click Advanced Chart, choose BackTest and select the my_first_strategy.efs we created.
The structure of a simple trading system
Before we start discussing the meaning of EFS functions and constant values, we need to understand the structure of the trading system. As we said already, a trading system is a set of rules to enter Short and Long positions. In other words, all BackTesting does can be described as 4 commands:
Enter Long
Exit Long
Enter Short
Exit Short
So, thewhole tradinf strategy is made up of a set of entries and exits. Every entry and exit takes place whenever a set condition is fulfilled, a condition that is called a trading signal.
In our example we have two trading signals. One is targeted whenever the price is crossed by the moving average downwards, another upwards. In the first case we we enter a Short position, in the second a Long one. As you see, our system contains no exits, such a system is called reversive (i.e. the signal to exit a Long position is the signal to enter a Short position).
Described in words, this is how our trading system looks:
If Moving Average crosses above Price then Exit Short and Entry Long
If Moving Average crosses below Price then Exit Long and Exit Long
Language syntax
Now let's revied the source code of our trading system step by step and use it to build other systems.
var study = new MAStudy(40, 0, "Close", MAStudy.SIMPLE);
In the first line we query the builtit variable for the value of the simple 40 day moving average.
setPriceStudy(true);
It determines whether a formula should be drawn in the same pane as the price data, or in an independent pane.
if(close() >= v && !Strategy.isLong())

       Strategy.doLong("Crossing Up", Strategy.MARKET,Strategy.THISBAR);
The first trading signal, oredring to enter a Long position if the close of today's bar is higher than the 40-day moving average.
if(close() < v && !Strategy.isShort())

       Strategy.doShort("Crossing Down", Strategy.MARKET,Strategy.THISBAR);
The second signal, oredring to enter a Short position if the close of today's bar is lower than the 40-day moving average.
	if(Strategy.isLong())

		setPriceBarColor(Color.lime);

	else if(Strategy.isShort())

		setPriceBarColor(Color.red);
Mark bars Red color if we're in a Short position and Green if we're in a Long.
Hope understanding this code was not an issue for you. Practically all trading systems are built this way. First select an indicator you want to base a system on, then define conditions for the signals and decide what position to enter whenever such a condition is fulfilled.
For an example, here's a strategy based on the RSI indicator, that enters a Long at RSI over 70 and a Short at RSI below 30.
var study = new RSIStudy(12, "Close");


function preMain() {

    setPriceStudy(true);

    setColorPriceBars(true);

    setDefaultPriceBarColor(Color.black);


}


function main(oversold,overbought) {

	if (overbought == null)

		overbought = 70;

	if (oversold == null)

		oversold = 30;


	var rsi = study.getValue(RSIStudy.RSI)


	if(rsi == null)

		return;

	if(rsi > overbought && !Strategy.isLong())

		Strategy.doLong("Long", Strategy.MARKET, Strategy.THISBAR);

	if(rsi < oversold && !Strategy.isShort())

		Strategy.doShort("Short", Strategy.MARKET, Strategy.THISBAR);

	if(Strategy.isLong())

		setPriceBarColor(Color.lime);

	else if(Strategy.isShort())

		setPriceBarColor(Color.red);

	return;

}
Let's see all the functions and constant values presented by EFS.
Fill Type Constants
Strategy.CLOSE - uses the closing price as the fill price.
Strategy.LIMIT - uses the StopOrLimit price as the fill price.
Strategy.MARKET - uses the open price as the fill price.
Strategy.STOP - uses the StopOrLimit price as the fill price.
Fill Bar Constants
Strategy.THISBAR - use the OHLC values of the current bar to determine the fill price in conjunction with the Fill Type.
Strategy.NEXTBAR - use the OHLC values of the next bar to determine the fill price in conjunction with the Fill Type.
LotSize Constants
Strategy.DEFAULT - uses the Default LotSize as the number of shares.
Strategy.ALL - typically used with Strategy.doSell or Strategy.doCover.
Specifies that all shares being held be sold/covered.
Strategy Functions
Strategy.doLong(Description, Fill Type, Fill Bar, LotSize, StopOrLimit)
Returns true if filled, false if not filled.
Strategy.doSell(Description, Fill Type, Fill Bar, LotSize, StopOrLimit)
Returns true if filled, false if not filled.
Strategy.doCover(Description, Fill Type, Fill Bar, LotSize, StopOrLimit)
Returns true if filled, false if not filled.
Strategy.doShort(Description, Fill Type, Fill Bar, LotSize, StopOrLimit)
Returns true if filled, false if not filled.
Strategy.isInTrade()
Returns true if currently in a trade (long or short). Otherwise false.
Strategy.isLong()
Returns true if currently long. Otherwise false.
Strategy.isShort()
Returns true if currently long. Otherwise, false.
Strategy.setStop(dStop)
Set a stop order. This will close out the active position if the stop order
price is
reached or exceeded.
Strategy.clearStop()
Clear (remove) the current stop order.
Strategy.getPositionSize()
Returns the number of shares currently held. This number is negative if short,
positive if long. Eg: -100 is short 100 shares. 100 is long 100 shares.
Strategy.getDefaultLotSize()
Returns the default lot size as set by the user before starting the backtest.
In the next chapters we'll see more examples of trading systems created using the functions listed above. If you alrady have any questions, we'll be glad to answer them.
Debugging the code
If your code works all right, it's great. But what if not? You should check whether your systems works the way you expect it to work. Debugging is the process of finding and correcting errors, and making mistakes when you're learning is common. You may make a mistake using the Java language, you may make a typo entering code - luckily, such situations are not hopeless. Most errors will be intercepted by the compiler, indicating here and how were you wrong. To read the compiler messages use the Formula Output Window, displaying information about all the errors you made.
Analysis of a trading system with the eSignal Strategy Analyzer
With the eSignal Strategy Analyzer you have the unique possibility to see the advantages and disadvantages of your strategy, to change the way you buy and sell, to improve trading robustness and to gain faith in your trading performance. The new eSignal Strategy Analyzer contains 6 sections accessible by clicking on tabs in the top part of the report window. Trading system performance is analyzed from different approaches, each accessible from its tab. Overall, the report provides over 250 values useful for strategy performance analysis, with multiple modes of graph presentation included. In the settings dialog box the user is able to create personal settings for displaying the values of the report and analyzing the strategy.
The total performance is easiest evaluated from the Strategy Analysis tab, which is at the same time hardly a sole measurement of strategy value. To get a complete picture of the strategy performance, take care to analyze the Strategy Analysis along with other sections.
The next two sections - the Trades and Trades Analysis show information on trades. The Trades tab represents each trade as a multi-column sheet. The Trade Analysis tab focuses on separate trades to estimate the overall strategy performance, with general trade analysis included.
The Time tab focuses entirely on the results viewed related in relation to time.
The Periodical Analysis tabs serve to broaden the analysis available from the Strategy and Trade Analysis tabs. The strategy performance is evaluated throughout periods of time annual, monthly or daily to evaluate consistency.
An user-friendly toolkit for graphic presentation and handling is included in the form of the Graphs module. The Graphs adds powerful visual display capabilities to the eSignal Strategy Analyzer analysis and evaluation.
eSignal Strategy Analyzer is equipped with a most powerful help feature. To see help information o any value you're interested in, just point you mouse and left-click when a question sign appears. Use this features when reading a report to save your time and learn to understand reports yourself without consulting the help section.
There can be no "general" way to read and interpret eSignal Strategy Analyzer's Reports. The system approach to trading is an inseparable part of trading as a profession. Naturally, every professional trader has a personal trading approach, personal preferences and view of risk/profit.
Some prefer daytrading using classic trend following approaches, some like intraday trading with numerous short trades. For some a loss of 15% from initial capital is not a problem at all, for some this kind of luxury is out of all question.
And surely there is not a single statistic value that tells if a trading system is good or bad. It all largely depends on personal preferences, but it's possible to point out a number of important issues that are worth attention when analyzing the eSignal Strategy Analyzer Report. In other words, no matter what your trading approach is, there are definite borders for the values to lie within.
The most common error of strategy analysis is ignoring the relative values, such as the Max Strategy Drawdown (%) or Return on Account. Usually the first that catches a beginner's attention is Total Net Profit. Naturally, since it's the overall dollar profit or loss achieved by the trading strategy in the test period. But Total Net Profit is not such an important values, since it shows only the absolute profit or loss value. You may have a large Total Net Profit, but all the same suffer unacceptable losses during trading.
So the prime values are Gross Loss and Max Strategy Drawdown. Gross Loss of a strategy is most important, yet often overlooked. It should be noted that net profit increases not only when gross profit improves, but also when gross loss is reduced. Analyzing and working over losing trades is an extremely important part of trading strategy analysis.
As to the Max Strategy Drawdown and Max Strategy Drawdown (%) values, they show the largest equity dip that took place during the test period. The largest equity dip is the biggest difference between an equity high and a subsequent equity low. The Max Strategy Drawdown value forms the Account Size Required, i.e. the amount of money you must have on the account to start trading the strategy.
Only after analyzing Max Strategy Drawdown and determining the Account Size Required we can make an adequate evaluation of the Total Net Profit. This is accomplished by the Return on Account value - the sum of money you would make compared to the sum of money required to trade the strategy, after considering the margin and margin calls. This value is calculated by dividing the Total Net Profit by the Account Size Required.
One can give many more indications about important valuse of the eSignal Strategy Analyzer. For instance, Total # of Trades must be over 30 to make sure that the results are statistically valid. Even if your have tested your strategy on 25 years of history data, if your system didn't take at least 30 trades, results won't be convincing.
Largest Winning Trade isnt't the most demonstrative value. But it's wise to have a look how the size of the Largest Winning Trade relates to the Avg Trade (win & loss), - i.e. whether the largest trade really is an Outlier Trade. Outliers trades are those that exceed the average trade by a significant value (plus or minus three (3) standard deviations). Considering this all it's wiser to pay attention to the Select Net Profit, than to usual Total Net Profit, since Select Net Profit is the modified Net Profit (with all outlying trades, both positive and negative, removed). The final value thus indicates the net profit for standard trades.
Max Consec. Losers may also turn out to be a most important valuse - as a measure of psychological stress you'll have to go through when trading this system. Knowing the maximal possible values you can avoid panic when consecutive losses really occur.
Ratio Avg Win / Avg Loss - this value must be over 1 (break-even). surely, anything over 5 is great results, but even with a value of about 2 profits can be good, if other values are within good bounds.
We've listed just the main values worthy of attention. Really, not a single value is useless - every one serves a purpose, informing the user of the trading system's performance. For more detailed information on every value use the hints sytem.
EFS backtesting samples
1-2-3 Reversal strategy
Moving Average & Price Crossover
Moving Average Crossover
RSI Strategy
Stochastic Crossover Strategy