Download: ACC_SWING.ELA
Category: Indicator > Trend Identificator
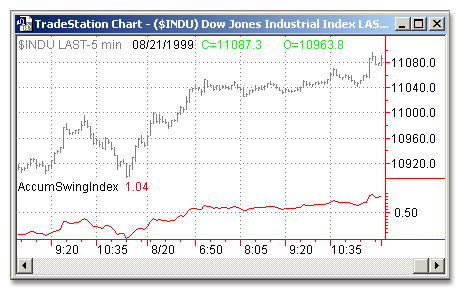
Description:
The Accumulative Swing Index plots a running total of the Swing Index value of each bar. The Swing Index is a value from 0 to 100 for an up bar and 0 to -100 for a down bar. The Swing Index calculation is made using the current bar’s Open, High, Low, and Close as well as the previous bar’s Open and Close. The Accumulative Swing Index is used to give a better long-term picture than the Swing Index, which uses data from only 2 bars.
Usage:
If the long-term trend is up, the Accumulative Swing Index is a positive value. Conversely, if the long-term trend is down, the Accumulative Swing Index is a negative value. If the long-term trend is sideways (non-trending), the Accumulative Swing Index fluctuates between positive and negative values. This indicator is primarily used to analyze futures but can be applied to stocks as well.
No Inputs
EasyLanguage Code:
PLOT1(ACCUMSWINGINDEX, "ACMSWGIDX");