Download: ADX_DIFF.ELA
File Includes:
Indicator - ELD ADX Differential
Category: Indicator > Trend Identificator
Description:
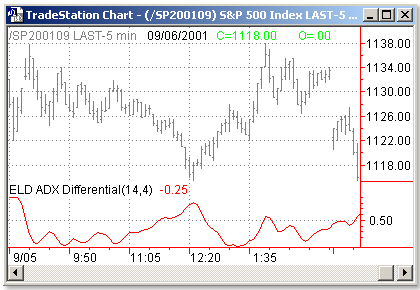
ADX Differential Indicator. This indicator attempts to finds directionless periods in the market using ADX indicator and looks for breakouts from previous range.
Usage:
The ADX is a unique indicator that shows the strength of the current trend; that is, whether or not the market is trending, and if so, how strong the trend is. The ADX Indicator does not indicate whether the trend is up or down, just whether or not it is trending and the strength of that trend. In fact, we consider the value of the ADX itself to be unimportant: what matters is the direction in which the indicator is moving.
Given that what is important is the relation of the current bar's ADX to last bar's ADX, this indicator will display the difference between last bar's ADX and this bar's ADX. When this value is increasing it means that the trend is strong. In order to smooth out the values and avoid choppiness, we will use a 4 bar average of the differential.
This indicator is used in the ADX Differential Strategy to identify directionless markets.
This indicator is best used in intra-day lower time compressions (example: 15 minute bars or smaller) or daily charts in order to give it more time to develop. Otherwise, with larget intra-day time frames the gap from open to close will cause the study to have unexpected results.

Inputs:
ADXLen - Number of bars used to calculate ADX
AvgLen - Number of bars in the ADX Differential average
EasyLanguage Code:
Input: ADXLen(14), AvgLen(4);

vars: DeltaADX(0), DeltaAvg(0);


{ Calculating indicator values }

value1 = ADX(ADXLen);

DeltaADX = value1 - value1[1];

DeltaAvg = WAverage( DeltaADX , AvgLen );


{ Plotting indicator on the chart }

Plot1( DeltaAvg, "DeltaAvg" );