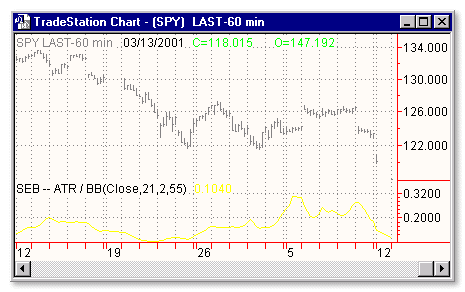
Download: SEB_ATR-BB.ELA
File Includes:
Indicator - SEB - ATR/BB
Category: Indicators > Trend Identificator
Description:
The construction of standard error bands is similar to that of Bollinger bands. The difference: instead of measuring the variance or degree of volatility around the average price using the standard deviation, standard error bands require the use of the standard error of the estimate around a 21-period linear regression line. The middle band is calculated as the ending value of a 21-period linear regression line and adding two standard errors to the ending value of the regression line to form the upper standard error band. To form the lower standard error band, subtract two standard errors from the end value of the linear regression line.
One method of using standard error bands is to plot standard error bands and Bollinger bands on the security data. At points where the Bollinger bands become tight, look for the standard error bands to reverse or continue in the same direction with new strength. One method one should use to measure the tightness of the Bollinger bands is to first calculate the 55-day average true range (55 ATR) of the price bars. Next, divide the 55 ATR by the difference between the upper and lower 21-day Bollinger bands.
Usage:
If this ratio exceeds 50%, this indicates that the market is trading at greater than 50% of the range encompassed by the Bollinger bands, and then the bands are considered tight. the author tells that this indicator to be at 50% or more as my first signal.
When the standard error bands start to turn in a particular direction, look at the %A oscillator to see if the security's price moves toward either the upper or lower band. The Bollinger bands will begin to expand. By determining the regression slope or subjectively determining the direction of the regression bands, the new direction should become clear through visual observation.

Inputs:
Price - price type to use
BBLen - number of bars to calculate Bollinger bands
StdDev - number of standard deviations to use
ATRLen - number of bars to calculate ATR
EasyLanguage Code:
INPUT: PRICE(CLOSE), BBLEN(21), STDDEV(2), ATRLEN(55);

VARS :  BOLLTOP(0), BOLLBOT(0), ATR(0), BBDIFF(0), ATRBB(0);


ATR = AVGTRUERANGE(ATRLEN);

BOLLTOP = BOLLINGERBAND(PRICE, BBLEN, STDDEV);

BOLLBOT = BOLLINGERBAND(PRICE, BBLEN, -STDDEV);

BBDIFF = BOLLTOP - BOLLBOT;


IF BBDIFF <> 0 THEN

	ATRBB = ATR / BBDIFF;


PLOT1(ATRBB, "ATR/BB");


{COPYRIGHT C 1997, TECHNICAL ANALYSIS, INC.}