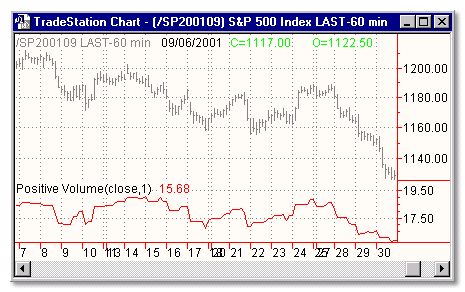
Download: posvol.ela
File Includes:
Indicator - Positive Volume
Function - PVI
Category: Indicator > Volume Based
Description:
The Positive Volume Index was introduced (in Stock Market Logic) by Norman Fosback and is often used in conjunction with Negative Volume Index to identify bull and bear markets. Positive Volume Index is based on the assumption that the uninformed crowd dominates trading on active days. Negative Volume Index assumes that the smart money dominates trading on quiet days. Positive Volume Index highlights days when volume is up on the previous day. Negative Volume Index highlights days when volume is down
Usage:
Interpretation of the PVI assumes that on days when volume increases, the crowd-following "uninformed" investors are in the market. Conversely, on days with decreased volume, the "smart money" is quietly taking positions. Thus, the PVI displays what the not-so-smart-money is doing. (The Negative Volume Index, displays what the smart money is doing.) Note, however, that the PVI is not a contrarian indicator. Even though the PVI is supposed to show what the not-so-smart-money is doing, it still trends in the same direction as prices.

Inputs:
Price - the data series to average
Length - the parameter tells how many bars to average
EasyLanguage Code:
INPUTS: PRICE(CLOSE), LENGTH(1) ;


PLOT1( PVI(PRICE, LENGTH), "PVI");