ZigZag Pnts: Difference between revisions
From MultiCharts
(→Inputs) |
No edit summary |
||
| (2 intermediate revisions by 2 users not shown) | |||
| Line 1: | Line 1: | ||
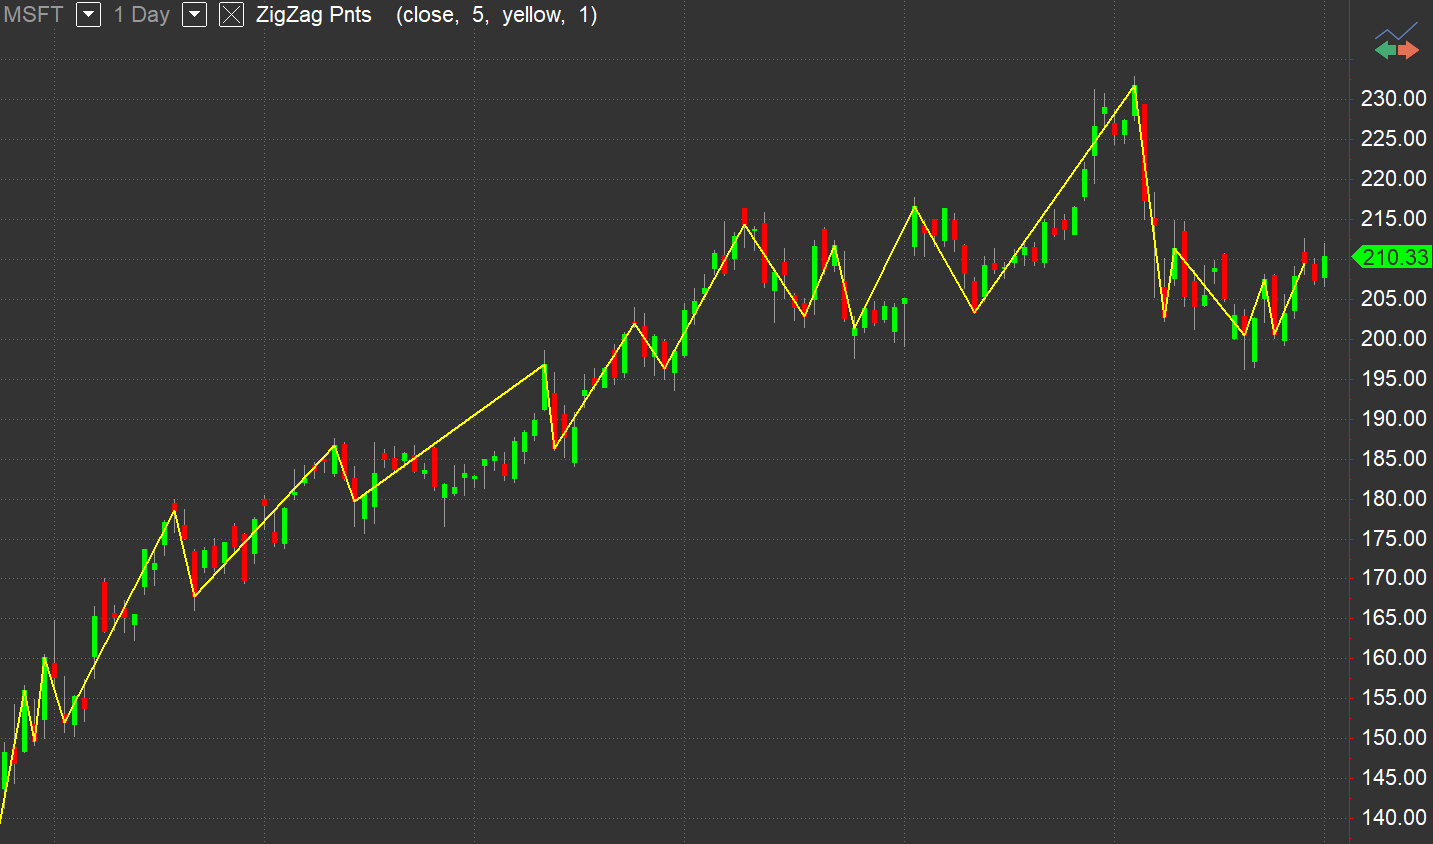
=== Definition=== | |||
The ZigZag Pnts indicator finds swing points that are at least some points defined by the RetracePnts input away from each other. A high swing point is where the price is higher than the previous or subsequent prices. A low swing point is where the price is lower than the previous or subsequent prices. | The ZigZag Pnts indicator finds swing points that are at least some points defined by the RetracePnts input away from each other. A high swing point is where the price is higher than the previous or subsequent prices. A low swing point is where the price is lower than the previous or subsequent prices. | ||
| Line 14: | Line 16: | ||
===Plots=== | ===Plots=== | ||
Values are not plotted. The indicator plots lines connecting high and low swing points. | Values are not plotted. The indicator plots lines connecting high and low swing points. | ||
[[File:ZigZig-Pnts-indicator.png|700px|link=https://www.multicharts.com/trading-software/images/8/86/ZigZig-Pnts-indicator.png]] | |||
[[Category:Pre-built Indicators]] | [[Category:Pre-built Indicators]] | ||
Latest revision as of 15:38, 6 December 2022
Definition
The ZigZag Pnts indicator finds swing points that are at least some points defined by the RetracePnts input away from each other. A high swing point is where the price is higher than the previous or subsequent prices. A low swing point is where the price is lower than the previous or subsequent prices.
Default Inputs
HighPivotPrice - price value indicating the pivot high
LowPivotPrice - price value indicating the pivot low
RetracePnts - minimum point difference between swing points to plot
LineColor - trendlines’ color
LineWidth - trendlines’ thickness
Plots
Values are not plotted. The indicator plots lines connecting high and low swing points.