Volume Brkout: Difference between revisions
From MultiCharts
(Created page with "The Volume Breakout indicator plots a dot at the high price of every bar which volume is at least 50% higher than the average volume of the last 50 bars. The number of bars us...") |
No edit summary |
||
| (2 intermediate revisions by 2 users not shown) | |||
| Line 2: | Line 2: | ||
This indicator triggers an [https://www.multicharts.com/trading-software/index.php?title=Using_Alerts alert] each time a volume breakout is found. | This indicator triggers an [https://www.multicharts.com/trading-software/index.php?title=Using_Alerts alert] each time a volume breakout is found. | ||
== Default Inputs == | == Default Inputs == | ||
'''AvgLength 50''' sets the number of bars used to calculate average volume.<br> | '''AvgLength (50)''' sets the number of bars used to calculate average volume.<br> | ||
'''BrkOutPct 50''' sets the percentage over the average volume in order to be considered a breakout. | '''BrkOutPct (50)''' sets the percentage over the average volume in order to be considered a breakout. | ||
[[File:Volume-Brkout-indicator.png|700px|link=https://www.multicharts.com/trading-software/images/0/0e/Volume-Brkout-indicator.png]] | |||
[[Category:Pre-built Indicators]] | [[Category:Pre-built Indicators]] | ||
Latest revision as of 16:02, 6 December 2022
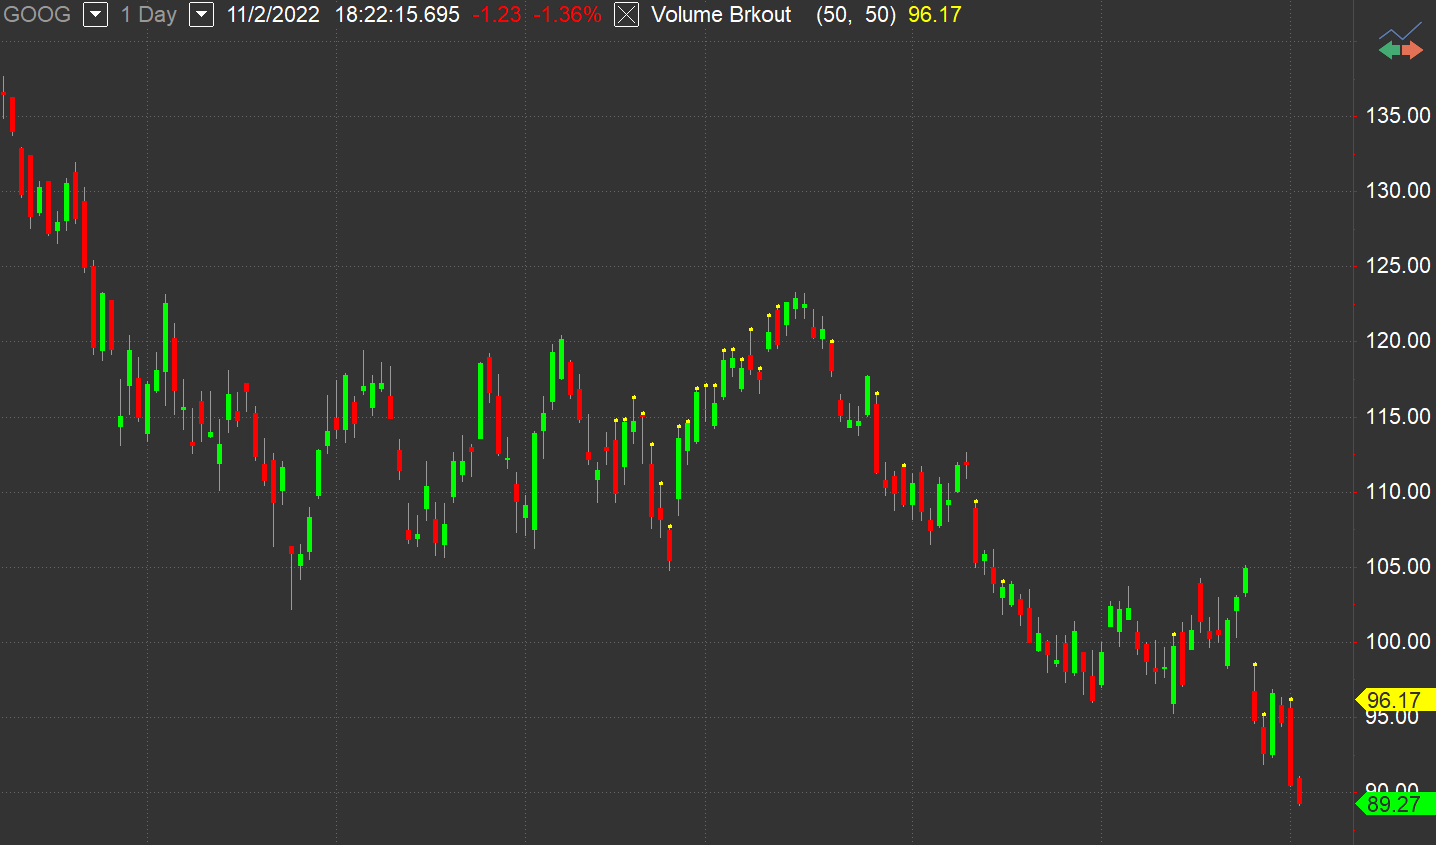
The Volume Breakout indicator plots a dot at the high price of every bar which volume is at least 50% higher than the average volume of the last 50 bars. The number of bars used to calculate the average (AvgLength) can be changed as well as the percentage used (BrkOutPct). This indicator triggers an alert each time a volume breakout is found.
Default Inputs
AvgLength (50) sets the number of bars used to calculate average volume.
BrkOutPct (50) sets the percentage over the average volume in order to be considered a breakout.