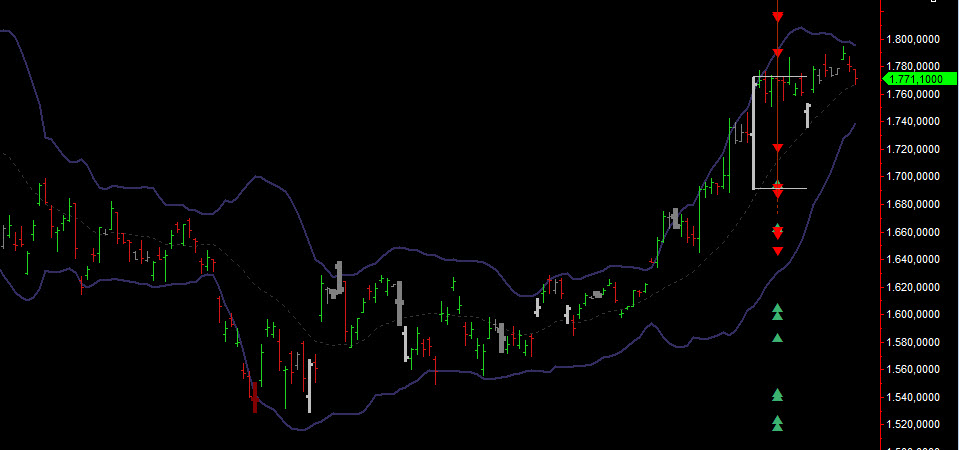
Applying two trendlines on a daily chart (Custom future for GC) and some arrow up / down icons on the chart. After restart of MC all of them are positionedto the second last bar. Not sure whether this happens with every restart but I put the trendlines and arrows a dozen times back but MC doesn't like it. So at the moment I can not use this very basic functionaliy.
Copying / Pasting the chart and using a new clean workspace doesn't help.
Position of Trendline and Arrows lost after restart [SOLVED]
-
Henry MultiСharts

- Posts: 9165
- Joined: 25 Aug 2011
- Has thanked: 1264 times
- Been thanked: 2957 times
Re: Position of Trendline and Arrows lost after restart
Hello PK1,
Is it possible for you to come to our Live Chat 6:30 am - 1 pm EST to demonstrate the problem remotely to the engineers? That will be the best and fastest way to procceed.
If you are unable to do that please send me the following:
1) What exact version and build number of MultiCharts are you running? (in MultiCharts go to Help tab-> About)
2) In QuoteManager right click on your Custom Futures->Export instruments (you need to export it with data)
3) Create a screenshot of the workspace with trendlines/arrows you have placed (original)
4) Create a screenshot of the workspace after the restart
5) Attach the workspace itself
Re: Position of Trendline and Arrows lost after restart
ok, after the demonstration one note:
the start date of the trendlines and the date of the arrows will also change when closing and reopening the workspace. Means: Closing and restarting of MC is not needed to reproduce the problem.
the start date of the trendlines and the date of the arrows will also change when closing and reopening the workspace. Means: Closing and restarting of MC is not needed to reproduce the problem.
Re: Position of Trendline and Arrows lost after restart
I've seen that the problem is not only when using such 'arrows' or trendlines, also 'equidistant channels' are lost after restart. The result seems to be the same. After restart the start date of this drawing is changed. This is a very basic thing and I dont understand why this is not working in MC.
Regarding the screenshots I think there is no need to say, that the original setting where different to the changed view.
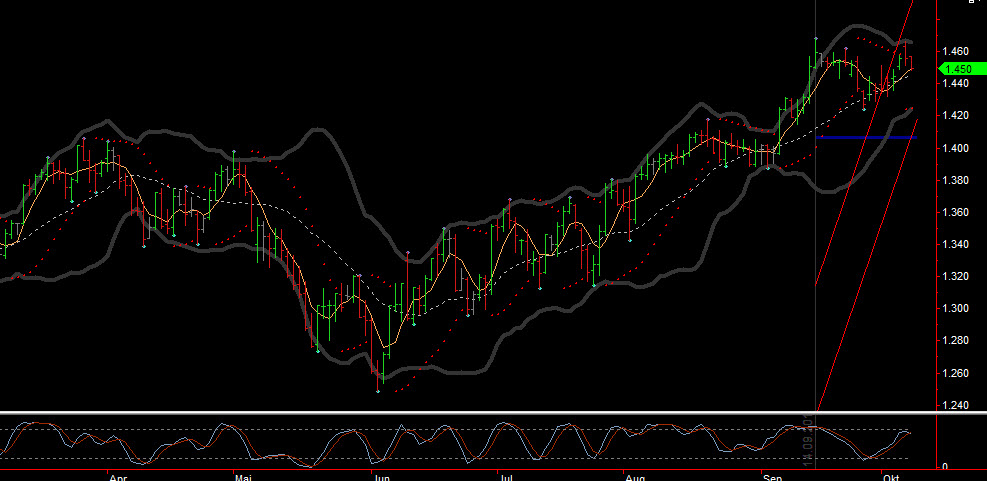
Regarding the screenshots I think there is no need to say, that the original setting where different to the changed view.
- Attachments
-
- EquidistantChannel.jpg
- EquidistantChannel
- (128.77 KiB) Downloaded 1437 times
-
- Trendlines_Arrows.jpg
- (84.57 KiB) Downloaded 1439 times
-
Henry MultiСharts
- Posts: 9165
- Joined: 25 Aug 2011
- Has thanked: 1264 times
- Been thanked: 2957 times
Re: Position of Trendline and Arrows lost after restart [SOLVED]
This issue has been fixed. The fix will be available in the next version of MultiCharts that is to be released later this fall.
The workaround for the moment is to place a drawing based on the data series, not indicator.
You can check it if you right click on the chart->Format Drawings->Base data # column
The drawing that has ESZ2 ( for ex. ) in Base data # column will be ok
The drawing that has Mov Avg 1 line ( for ex. ) in Base data # column can lose its position after opening the workspace
The visual order of data series and studies can be setup if you right click on the chart->Visual order.
You need to send the data series to back and then place a drawing.