Hello,
I use IQFeeD data and Daily bars.
Beside standard Volume indicator I`d like to have e.g. volume from session beginning to 6 AM for some futures contracts or volume for any other customized time period. Is it possible to code it in MC? Maybe someone has something similar and could share the code? Thanks
Btw, I need only volume info in chart title
Volume Indicator with specified time. Is it possible on MC?
-
Henry MultiСharts

- Posts: 9165
- Joined: 25 Aug 2011
- Has thanked: 1264 times
- Been thanked: 2957 times
Re: Volume Indicator with specified time. Is it possible on
Hello DRCM,
That is possible to calculate volume for customized time period. You will need to reference intraday data in order to do such calculation.
That is possible to calculate volume for customized time period. You will need to reference intraday data in order to do such calculation.
Re: Volume Indicator with specified time. Is it possible on
Does it mean that I`ve got to check "Build Minute and Daily Bars based on Tick Data" in QM?Hello DRCM,
That is possible to calculate volume for customized time period. You will need to reference intraday data in order to do such calculation.
Cuold you give more details about it as I`m not one of those who knows Power Language programming
-
TJ

- Posts: 7743
- Joined: 29 Aug 2006
- Location: Global Citizen
- Has thanked: 1033 times
- Been thanked: 2223 times
Re: Volume Indicator with specified time. Is it possible on
can you draw a mock up chart to illustrate how it would look like?Hello,
I use IQFeeD data and Daily bars.
Beside standard Volume indicator I`d like to have e.g. volume from session beginning to 6 AM for some futures contracts or volume for any other customized time period. Is it possible to code it in MC? Maybe someone has something similar and could share the code? Thanks
Btw, I need only volume info in chart title
Re: Volume Indicator with specified time. Is it possible on
Hi TJ,
It should look like normal Volume or Volume Avg indicator, but to show not total current day`s volume, but specified time volume. E.g. I want to know what was volume for 10yr US Treasury Futures from 17:00ET(session start time) to 1:00ET and etc. when I wake up in the morning. If it`s possible to get it on Daily resolusion probably we could use current Volume Avg indicator code and add a few extra lines to the code to get specified time. Since I don`t work with PL yet was trying to find some help in this forum.
Thanks in advance
-
arnie

- Posts: 1594
- Joined: 11 Feb 2009
- Location: Portugal
- Has thanked: 481 times
- Been thanked: 514 times
Re: Volume Indicator with specified time. Is it possible on
If your time period is fixed you can create a session template and plot the volume for that period.
10YR note 5pm till 1:00am CT.
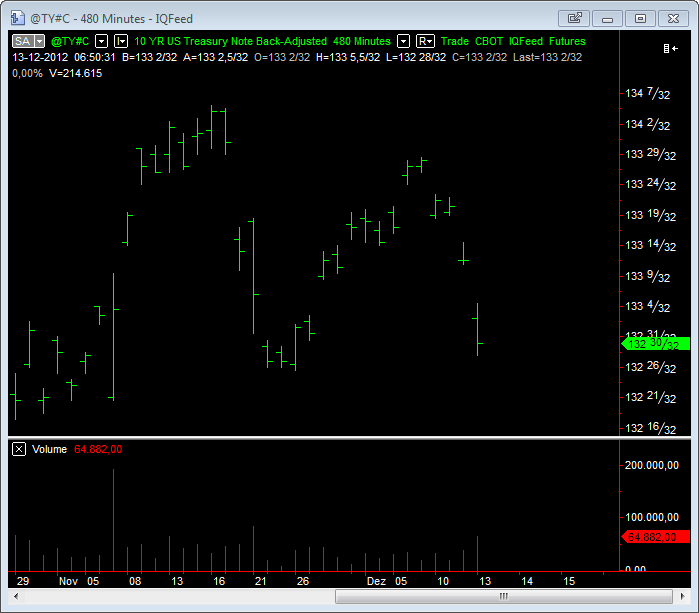
Hide the price bars and you will only see the volume.
10YR note 5pm till 1:00am CT.
Hide the price bars and you will only see the volume.
- Attachments
-
- ZN.png
- (26.19 KiB) Downloaded 844 times
Re: Volume Indicator with specified time. Is it possible on
Hello Arnie,
All I need is Specified time Volume info in chart title. I wouldn`t use indicator itself anyway.
E.g. At the moment I use Volume Avg indicator, but histogram and line set to Invisible on the same chart, so, I get current volume and average volume visible only in chart title. So, that`s all what I need , but only for specified time.
With you given example I would probably need to create additional subchart which is not acceptable for me because I save space on the screen (I use 4 chart windows on the screen, so, they are quite small in size already). I can`t use your example on the same main price chart because I`ve got my exchange, session times linked for appropriate symbol already.
P.S. Does MC see intraday price action (inside the bar) if I use Daily resolution? If yes, it should be possible to add a few additional lines to the existing volume code and get specified time. If not, probably only workaround can help which is sometimes not acceptable or too much hassle to do it if you use a lot of charts.
Thanks
-
arnie
- Posts: 1594
- Joined: 11 Feb 2009
- Location: Portugal
- Has thanked: 481 times
- Been thanked: 514 times
Re: Volume Indicator with specified time. Is it possible on
What do you consider as the chart title?
The red square zone on the image below?

If so, you need to go to PM and request this feature.
If you only need to see the text and not the indicator itself you could do something like this:
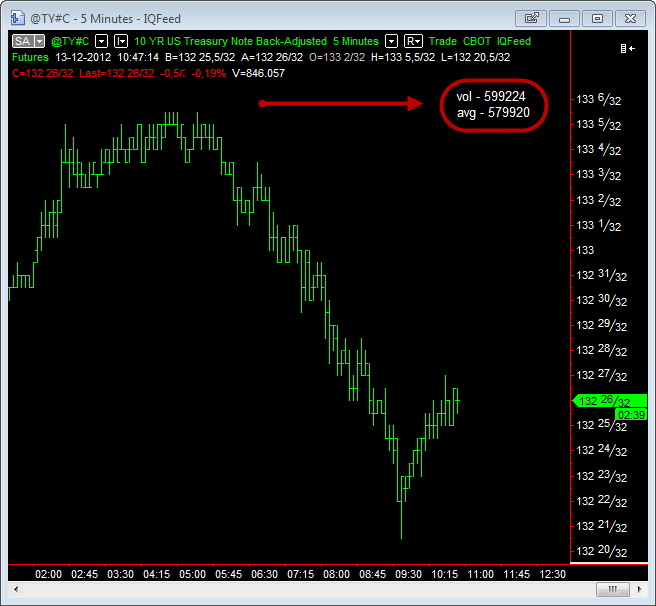
It's the total volume traded inside a time period you select, in this case, the RTH period.
Here is a very basic study:
Note however that you are requesting the time period to be analysed between yesterday's 17:00 pm and today's 1:00 am. That needs a much more complex code, which is beyond my knowledge.
The red square zone on the image below?
If so, you need to go to PM and request this feature.
If you only need to see the text and not the indicator itself you could do something like this:
It's the total volume traded inside a time period you select, in this case, the RTH period.
Here is a very basic study:
Code: Select all
if currentbar = 1 then begin

	value3 = text_new(Date, Time, GetAppInfo(aiHighestDispValue), "");

		text_setcolor(value3 , white);

		text_setsize(value3 , 10);

 	  	text_setstyle(value3, 0, 0);

end;


if BarType >= 2 then

	value1 = Volume

else

	value1 = Ticks;


if date <> date[1] then begin

	value2= 0;

end;


if time > 720 and time < 1400 then begin

	value2 = value2 + value1;

	value4 = average(value2, 5);

end;


Text_SetLocation(value3, Date,Time, GetAppInfo(aiHighestDispValue));

text_setstring(value3, "vol" + " - " + numtostr(value2, 0) + newline +

	"avg" + " - " + numtostr(value4, 0));


//plot1(value2);- Attachments
-
- volume_text.png
- (29.57 KiB) Downloaded 624 times
-
- window_title.png
- (5.33 KiB) Downloaded 627 times