Oanda "1 Change" chart [SOLVED]
Oanda "1 Change" chart
I noticed there are many small horizontal lines in Oanda "1 Change" chart (as attached jpg). I think for a "1 change" chart every new point should be a new price so that means the "Change" bar. I don't why this chart has many small horizontal line segment which means price is not changed there...
- Attachments
-
- 1change.JPG
- (66.67 KiB) Downloaded 846 times
Re: Oanda "1 Change" chart
I attached a "1 Tick" chart for same instrument and Oanda data. The 1 Tick chart just looks like a "1 Change" chart where every new point is a new price...
- Attachments
-
- 1tick.JPG
- (63.94 KiB) Downloaded 826 times
Re: Oanda "1 Change" chart
This is my 1 change chart for same instrument on same broker.I noticed there are many small horizontal lines in Oanda "1 Change" chart (as attached jpg). I think for a "1 change" chart every new point should be a new price so that means the "Change" bar. I don't why this chart has many small horizontal line segment which means price is not changed there...
Make sure chart type is candlesticks and not 'line on close' and have the time scale to show empty periods. That would be my first thoughts as to why yours is different.
- Attachments
-
- oand 1 change chart.png
- (46.19 KiB) Downloaded 809 times
Re: Oanda "1 Change" chart
A line chart by definition connects between closing prices only.Thanks, but I really want to see line chart not candlestick bars for 1 Change and 1 Tick chart.
The "Show Empty Periods" makes no different for my 1 Change line-on-close chart.
Therefore you the horizontal line just means the closing price was the same not that price didn't change.
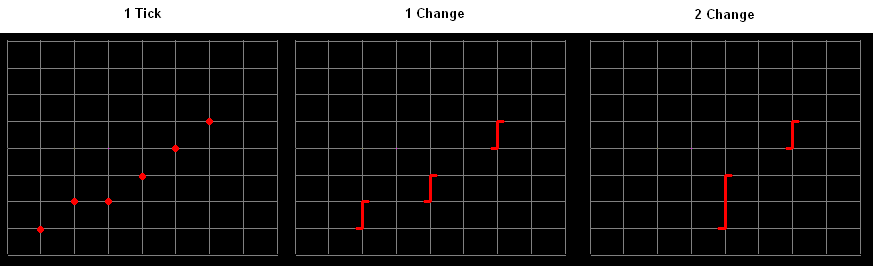
Look at the line chart against a candlestick chart as per attached and you can see the price changes within the candlestick and why the line chart shows horizontal lines.
A line chart can only connect one price point to another be it close to close, open to open and thus the point of a line chart is not to see every price extreme/change, merely a smoother display of close to close prices.
- Attachments
-
- oanda 2.png
- (5.33 KiB) Downloaded 817 times
Re: Oanda "1 Change" chart
The point is my chart setting is "1 Change" chart. Isn't that meaning the price must changed to have a new point drawing?
If it's a "1 Second" or "1 Tick" chart, it's normal that the "closing price was the same".
If it's a "1 Second" or "1 Tick" chart, it's normal that the "closing price was the same".
A line chart by definition connects between closing prices only.Thanks, but I really want to see line chart not candlestick bars for 1 Change and 1 Tick chart.
The "Show Empty Periods" makes no different for my 1 Change line-on-close chart.
Therefore you the horizontal line just means the closing price was the same not that price didn't change.
-
Henry MultiСharts

- Posts: 9165
- Joined: 25 Aug 2011
- Has thanked: 1264 times
- Been thanked: 2957 times
Re: Oanda "1 Change" chart
Hello wzero,
Here is how 1 Change chart works:
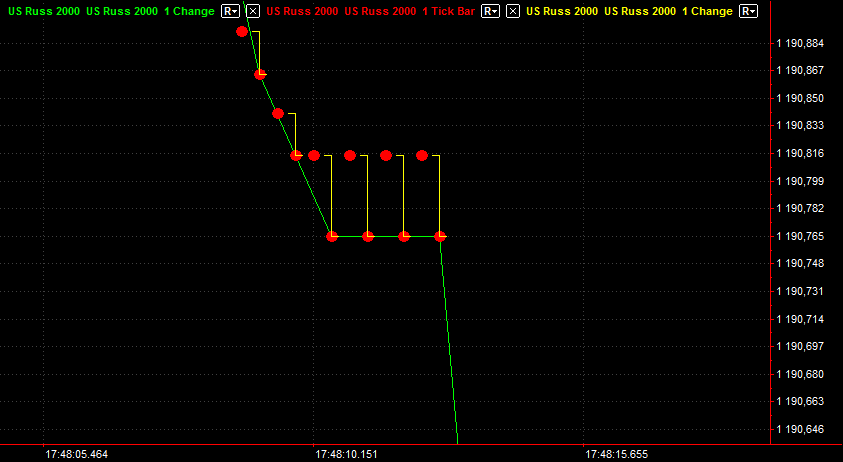
Each bar represents a certain price change when using the Change resolution. The bar closes if a certain amount of price changes is reached. Each new bar starts with a new tick.
LA901 has provided a correct detailed description. Please have a look at the following screenshot. There are 8 ticks in a row jumping between two prices. Red dots show ticks. Yellow OHLC bars show 1 change as a bar. Green line connects closes of 1 change bars. So there is a price change for the required increment (1 change = 1 tick ) which generates a new 1 change bar.
Here is how 1 Change chart works:
Each bar represents a certain price change when using the Change resolution. The bar closes if a certain amount of price changes is reached. Each new bar starts with a new tick.
LA901 has provided a correct detailed description. Please have a look at the following screenshot. There are 8 ticks in a row jumping between two prices. Red dots show ticks. Yellow OHLC bars show 1 change as a bar. Green line connects closes of 1 change bars. So there is a price change for the required increment (1 change = 1 tick ) which generates a new 1 change bar.
- Attachments
-
- 1 change.png
- (16.41 KiB) Downloaded 945 times
Re: Oanda "1 Change" chart [SOLVED]
Well, so "1 change" represents 2 ticks (1 tick for open price, another for close price). I just thought "1 change" should represents each 1 tick! (last tick for open price, new tick for close price).