Something really weird just happened here.
I disconnected my computer Friday and only turned it on today, Monday.
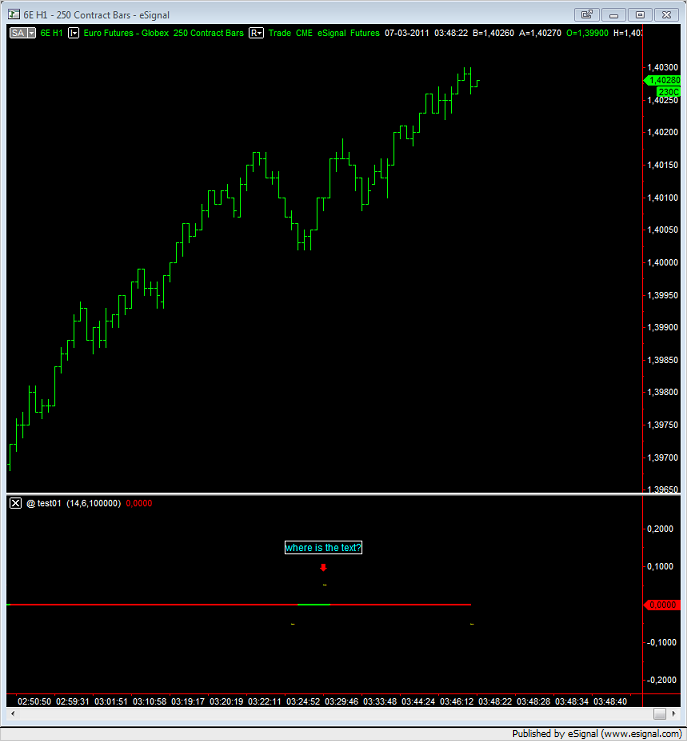
On Friday all was working fine, all indicators were plotting correctly, but today, all indicators that plot text, that same text is not shown.
What happened?
The indicator is compiled, I removed it form the chart, inserted it again, and no text is being shown, only a dot where should be the text.
I have no idea what to do here.
I'm using version 6.1
Has this happened to you before?
-
arnie

- Posts: 1594
- Joined: 11 Feb 2009
- Location: Portugal
- Has thanked: 481 times
- Been thanked: 514 times
Re: Has this happened to you before?
To help explain what is happening...
Where I previouly had this:
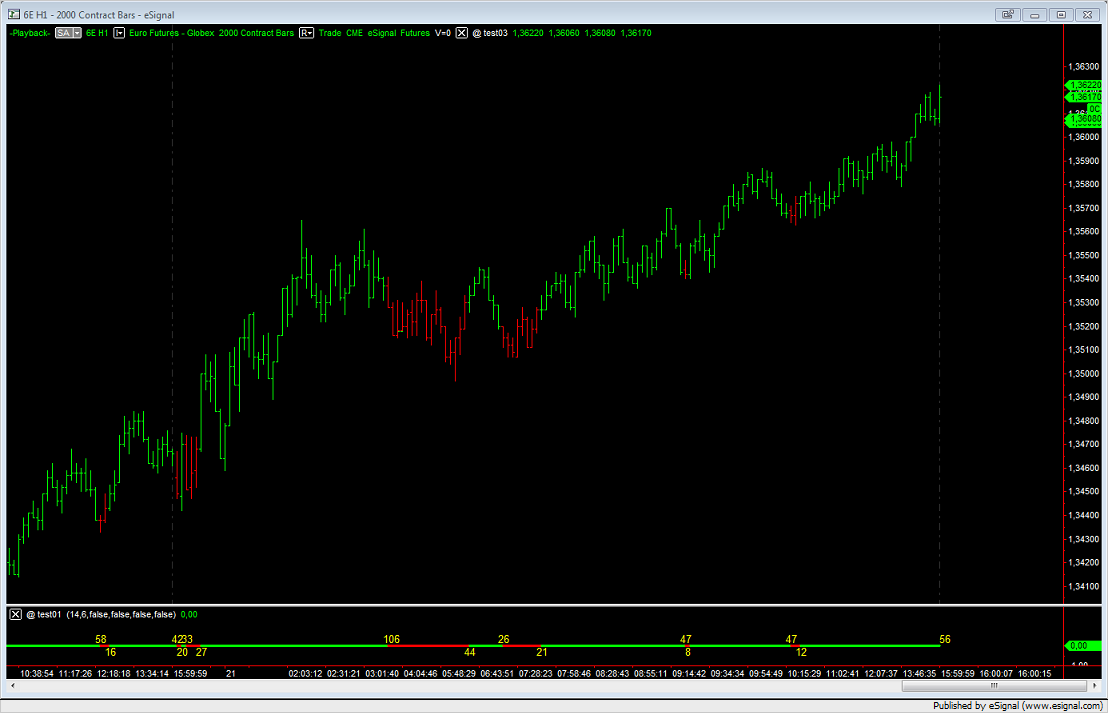
Now I have this:
Using the study published here:
http://www.multicharts.com/discussion/v ... f=5&t=8103
In the last message of the thread.
Where I previouly had this:
Now I have this:
Using the study published here:
http://www.multicharts.com/discussion/v ... f=5&t=8103
In the last message of the thread.
- Attachments
-
- missing_text.png
- (54.13 KiB) Downloaded 346 times
-
TJ

- Posts: 7744
- Joined: 29 Aug 2006
- Location: Global Citizen
- Has thanked: 1033 times
- Been thanked: 2224 times
Re: Has this happened to you before?
Did you used the playback function?Something really weird just happened here.
I disconnected my computer Friday and only turned it on today, Monday.
On Friday all was working fine, all indicators were plotting correctly, but today, all indicators that plot text, that same text is not shown.
What happened?
The indicator is compiled, I removed it form the chart, inserted it again, and no text is being shown, only a dot where should be the text.
I have no idea what to do here.
I'm using version 6.1
This can happen if a playback point somehow caught between a text format statement.
You have to exit the chart and reload it. It should look ok then.
-
arnie
- Posts: 1594
- Joined: 11 Feb 2009
- Location: Portugal
- Has thanked: 481 times
- Been thanked: 514 times
Re: Has this happened to you before?
No I didn't.
That first image is the same used when I discussed that same study in the forum. I used it to compare the difference.
I tried everything, at the end the only option was to uninstall MC completely.
Apparently the problem was in the StudyServer since when I paste the backup copy that I had made into the new folder after the installation, the problem continued.
Then I exported all my studies into a .pla file. Removed the old StudyServer folder, paste the one created in this new installation that I copied earlier. Then imported the .pla file with all my studies and all returned to normal.
If MC had lost some function or something during Friday's shutdown, that could have generated an error on some of the studies, but the thing is that all studies were compiled. No error was detected, and everything that was text related just disappeared from the charts.
Very strange reaction.
-
TJ
- Posts: 7744
- Joined: 29 Aug 2006
- Location: Global Citizen
- Has thanked: 1033 times
- Been thanked: 2224 times
Re: Has this happened to you before?
Actually the text did not disappear.
You can still see a little dot on the chart. That is actually the text, but the size is so small that it appears like a dot.
If you right click on the dot, a Format Text window will pop up and you can change the text attributes to make it bigger.
(I did not mention it earlier because that is not the solution to the problem).