Hi,
I'm attempting to determine why a script I had coded in Wealth-lab is producing different results in Multicharts. I've been able to track the difference to the value of the BollingerBands between the two platforms, and specifically to the StandardDev function in MC that the BollingerBand indicator is using. The function is producing output that is different from both wealth-lab and Microsoft Excel for the price series that I am testing. Is the code for Functions such as StandardDev available? I see a "Functions" folder in the PowerLanguage editor, but it contains no files.
Below is an example calculating std dev of the last 3 closes.
Close prices: $95.23, $95.95, $95.88
Expected standard deviation: 0.397 (reported by Wealth-lab and Excel)
Actual standard deviation: 0.324 (reported by Multi-charts).
Thanks,
-Rob
Source for StandardDev function
-
Henry MultiСharts

- Posts: 9165
- Joined: 25 Aug 2011
- Has thanked: 1264 times
- Been thanked: 2957 times
Re: Source for StandardDev function
Hello Rob,
The source code of the functions has been opened in MultiCharts 8.5 beta. You can download it from this page.
Here is how the Standard Deviation is calculated:
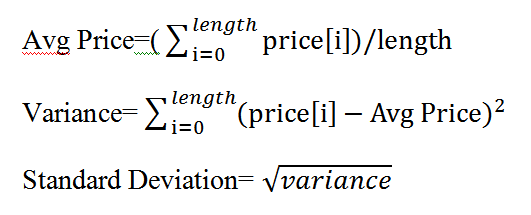
The source code of the functions has been opened in MultiCharts 8.5 beta. You can download it from this page.
Here is how the Standard Deviation is calculated:
- Attachments
-
- StandardDev.PNG
- (11.33 KiB) Downloaded 969 times
Re: Source for StandardDev function
So there are actually 2 different ways to calculate variance and subsequently standard deviation, for a sample and for a population. It looks like MC is using the population based calculation even though the indicators are only calculating their values based on a small subset of the price history, ie the last 5 closes for a 5 period bollinger band.
My guess is that the only way around this problem is to create my own b band indicators that use the Sample variance and standard deviation calculations rather than Population based, unless there's a simpler method.
thanks,
-Rob
My guess is that the only way around this problem is to create my own b band indicators that use the Sample variance and standard deviation calculations rather than Population based, unless there's a simpler method.
thanks,
-Rob

Re: Source for StandardDev function
Rob, the difference between sample and population standard deviation is whether you divide by N or N-1. So, you can reconcile the MC figure with the Excel figure by squaring it, multiplying by N/(N-1), and taking the square root. Using the figures from your example:
0.324^2 * (3/2) = 0.397^2
0.324^2 * (3/2) = 0.397^2