Maybe something like this : it plots the previous days ETH highs and lows(data2) on the current RTH data1 chart...(if that's what you want)..might need some tweaking..
If we plot your code and the data2 only shows globex session, 1700 till 830, we get the exact same result, no lines for today's RTH session.
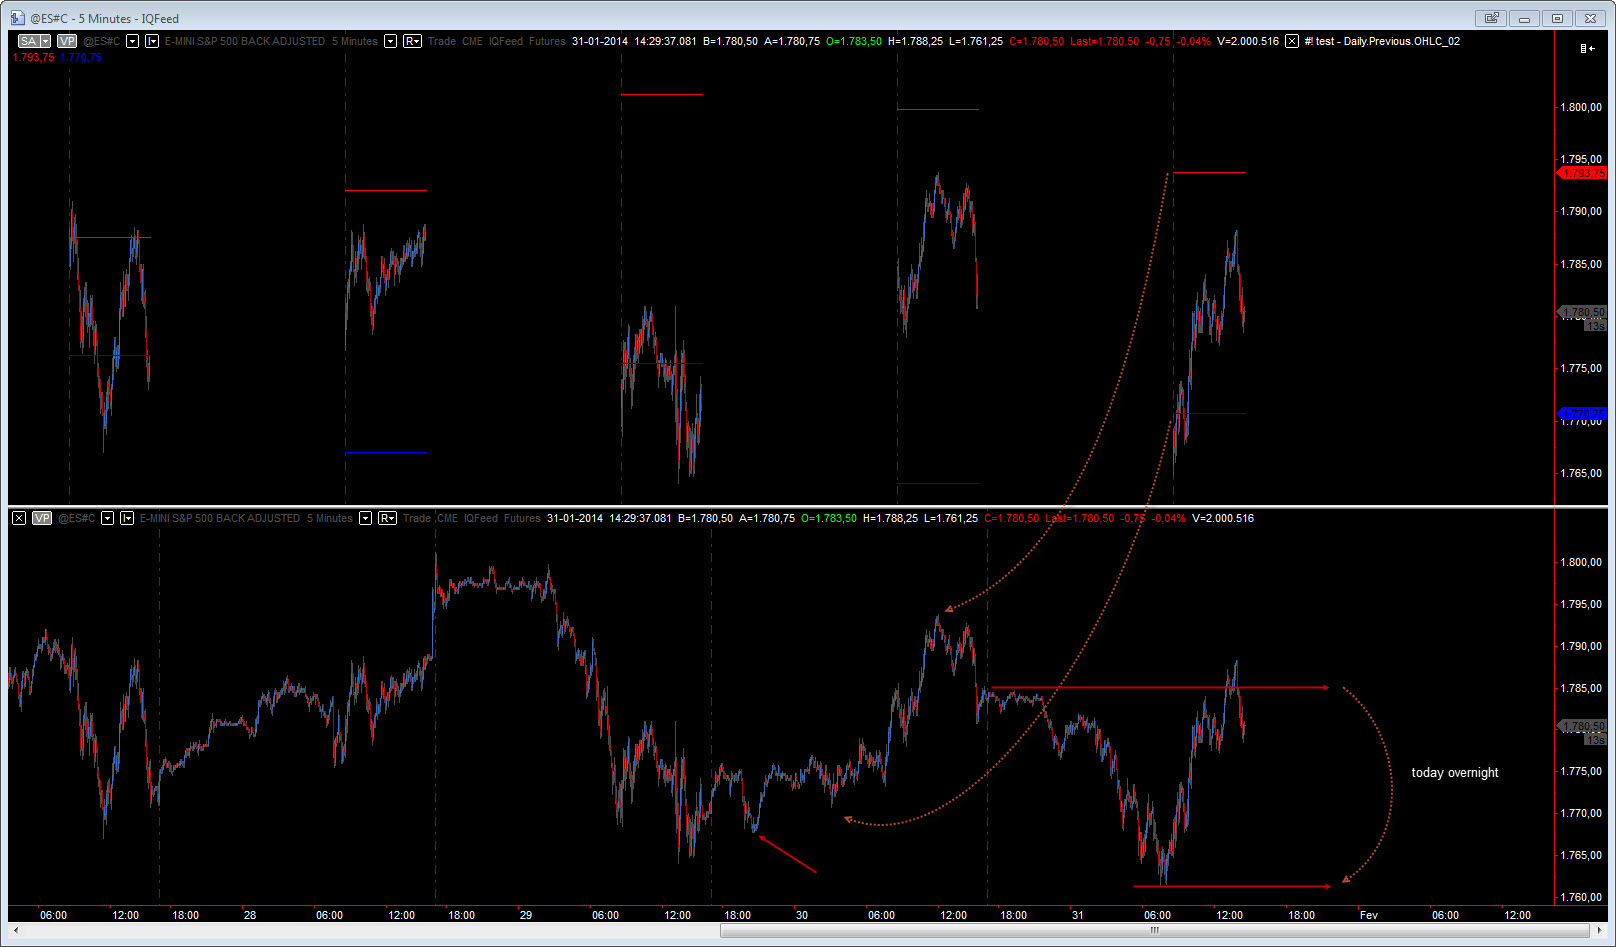
If data2 is a 24h session (1700 till 1515), I don't use the last 45min of the day on ES, the result is on the attached image.
On the RTH series you indeed get previous day high and low, which in this case, since we have a 24h session, the high which is being plotted was made on the RTH session and not on the ETH.
Also, you are reporting to yesterday's high and not today's overnight session high.
Another issue is the fact the yesterday's low refers to the low made around 3am CT but the actual low was made around 8:30pm CT. HighD and all similar functions reset the day at midnight. When we deal with 24h sessions, namely future sessions the only function capable of recognizing the overnight is the CurrentSession.
ABC coded for me a couple of years ago a study that reads perfectly the overnight session but amazingly it does not work when I add a second data series.
Everytime I add a second data series the overnight high and low reading is made after midnight. All data between 5pm and midnight is not considered.
Again, it seems that data1 session template takes precedence over all other data series session templates.
If data1 is plotting RTH session only and your data2 plots ETH data and your study retrieves data from the ETH correctly, since you're plotting the results on the RTH chart (data1), all data2 data prior to midnight will not be considered.