Monitoring and tracking your opportunities
The majority of data providers have a limitation on the number of simultaneous real-time data subscriptions. This made scanning numerous markets almost impossible. But our team have found a workaround. Market Scanner of MultiCharts 64-bit version can scan unlimited number of symbols one by one with a specified frequency or just rescan all on your demand.
It's especially helpful when analyzing stock markets — they are vast, so it may be hard to see a full picture sometimes. That's why it is important to know Market Scanner to find opportunities. Keep reading to find more details on how it works.
MultiCharts
How does Market Scanner work?
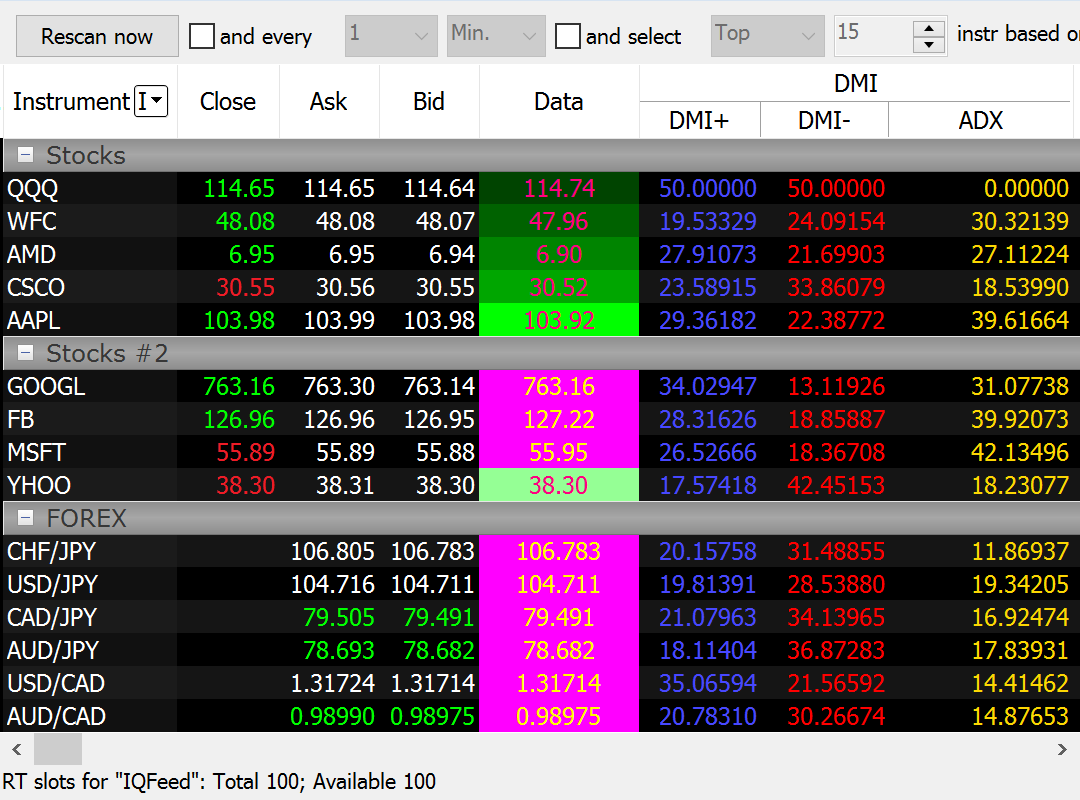
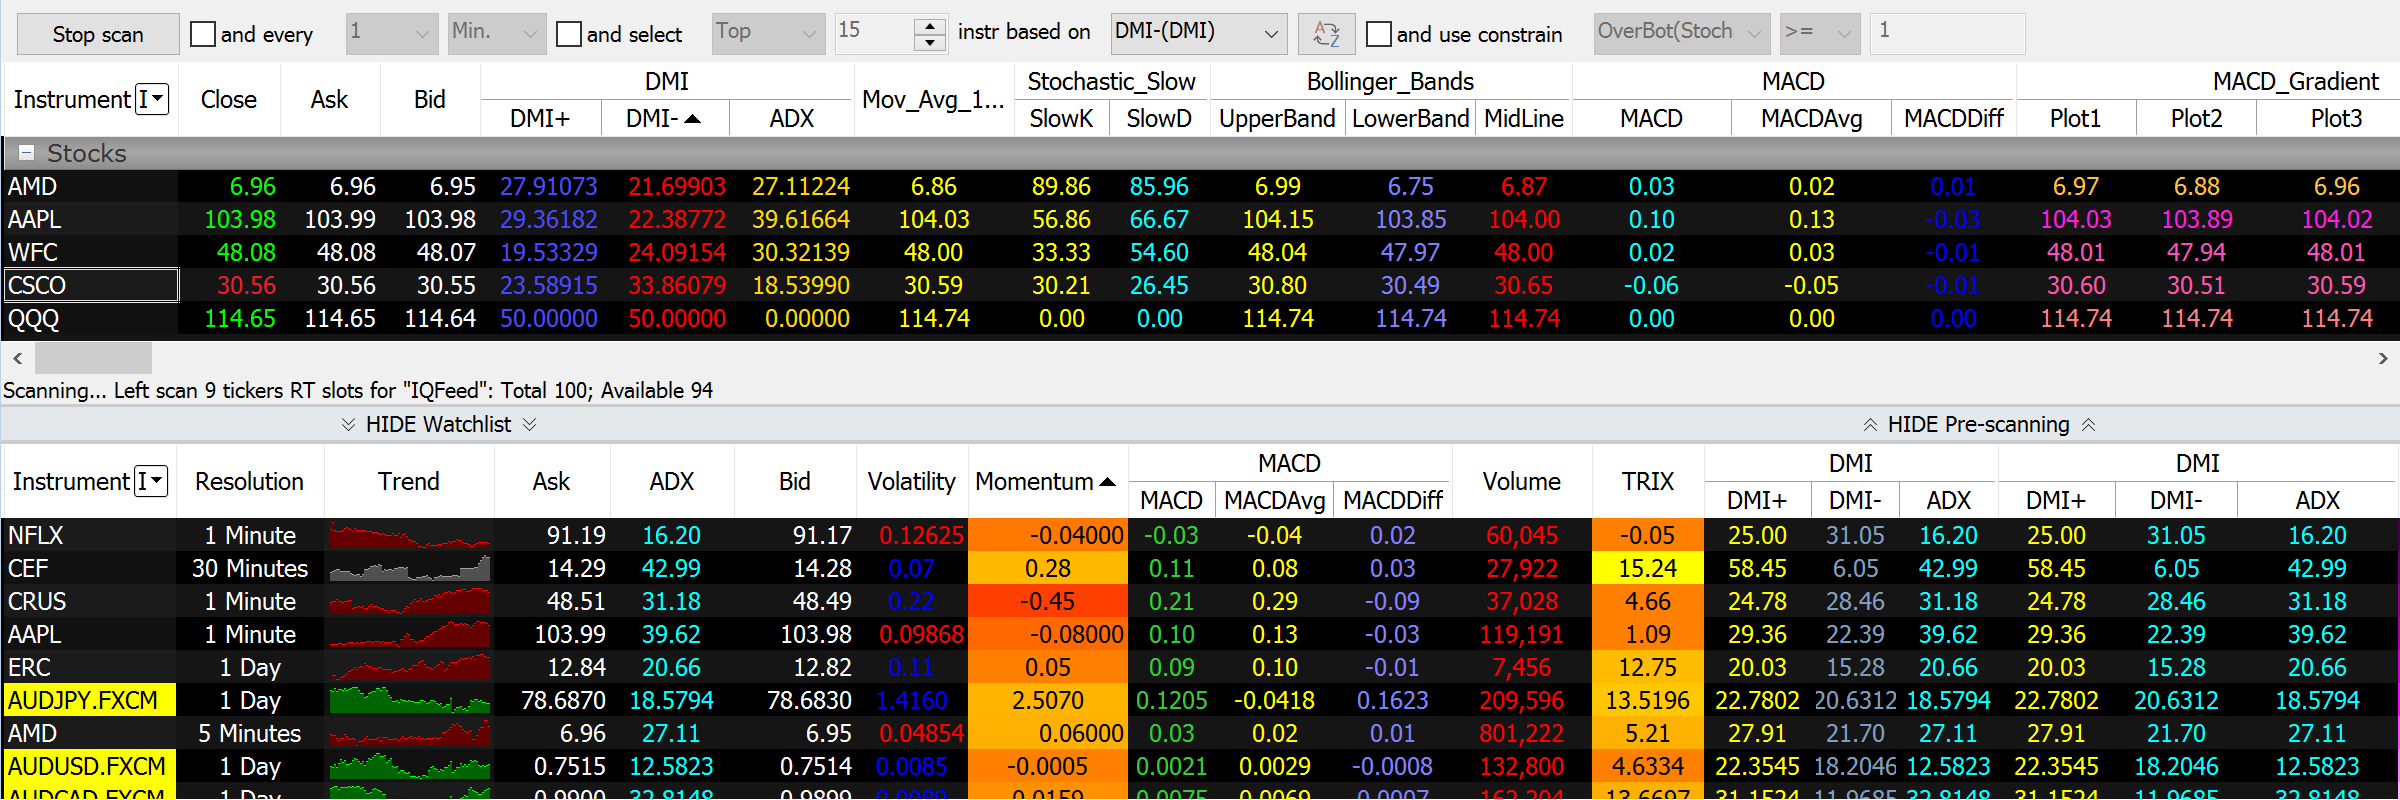
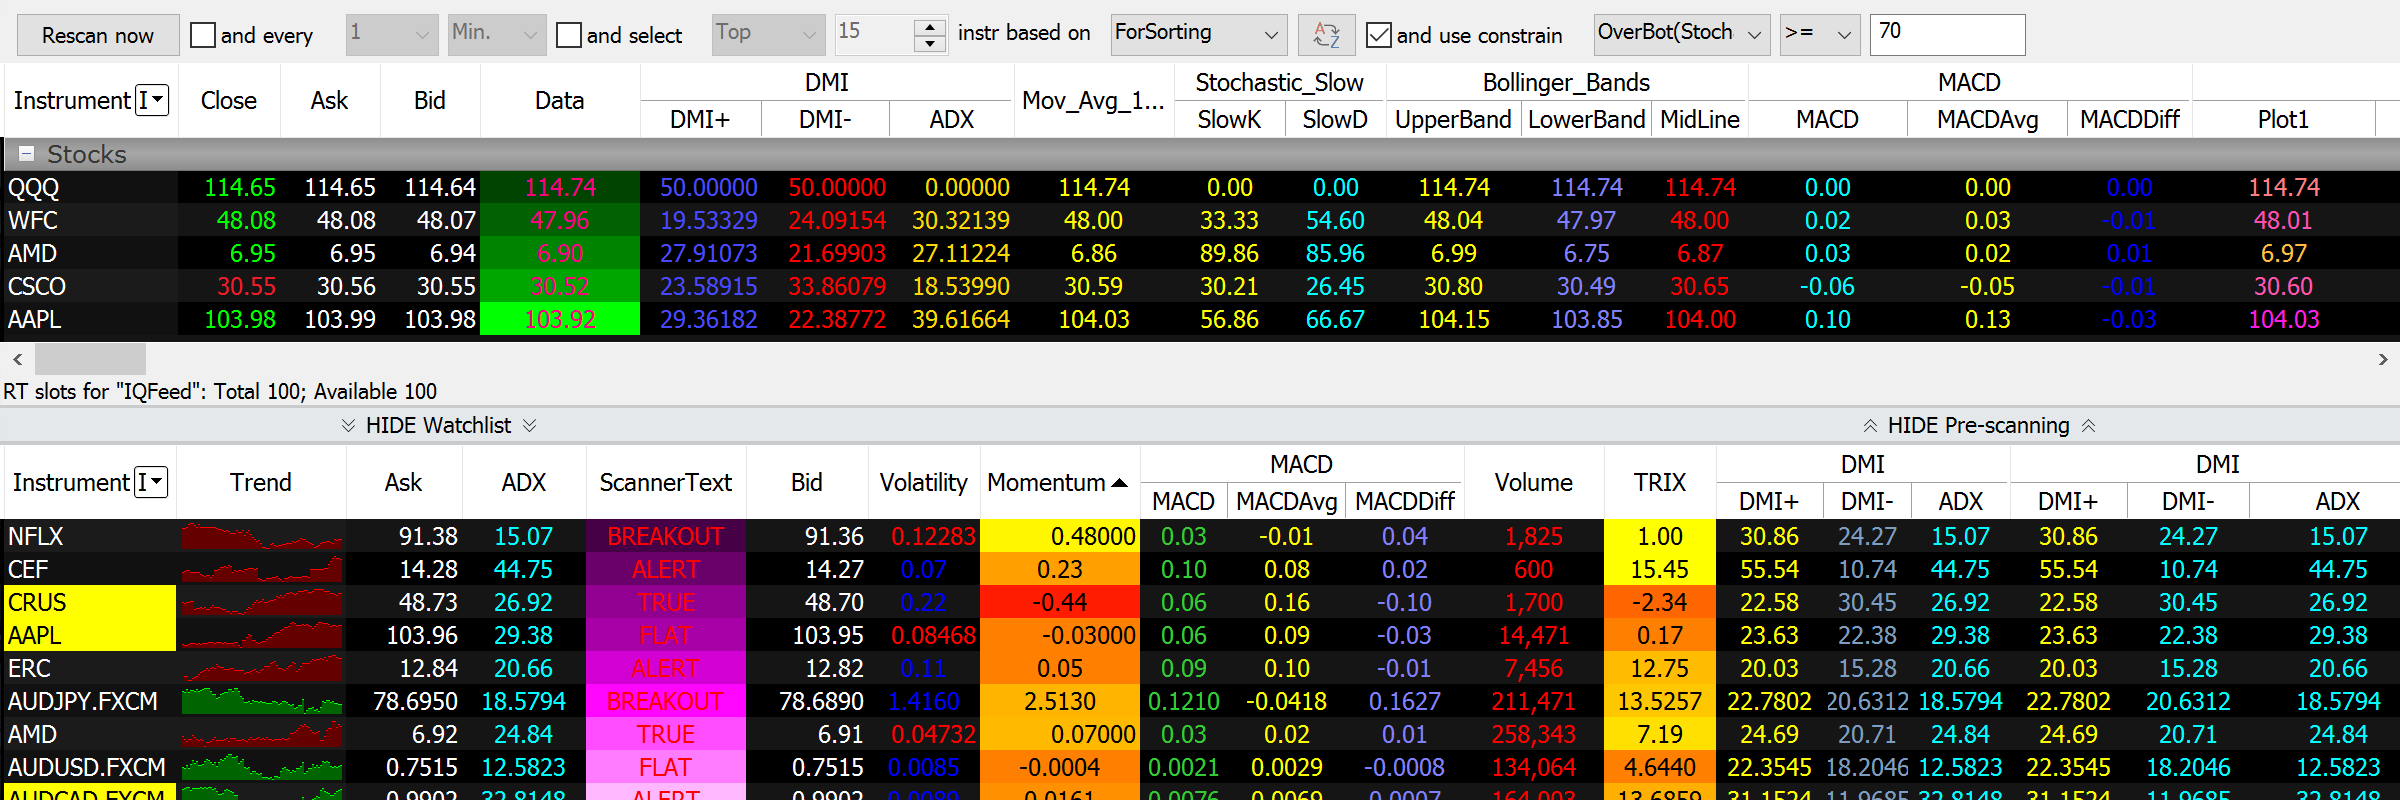
When one sets up filters in Pre-Scanning section the instruments that satisfy the conditions will be shown in Watchlist window for monitoring in real-time. For example, you want to find all symbols that have oversold recently. The logic is that these instruments will be below their normal value and they present a potentially profitable opportunity. Simply add symbols that interest you into Pre-scanning list, insert a pre-built or custom indicator, and specify the threshold value. Those symbols that satisfy the conditions will be shown in Watchlist window for updating in real-time.
You can also start scanning immediately by pressing Rescan now button. As soon as all the requested data is obtained, instruments will be unsubscribed from the data source and data will be requested for the next set of instruments. The results are evaluated by the scanning criteria and satisfying instruments are copied into the Watchlist part of the scanner window.
MultiCharts
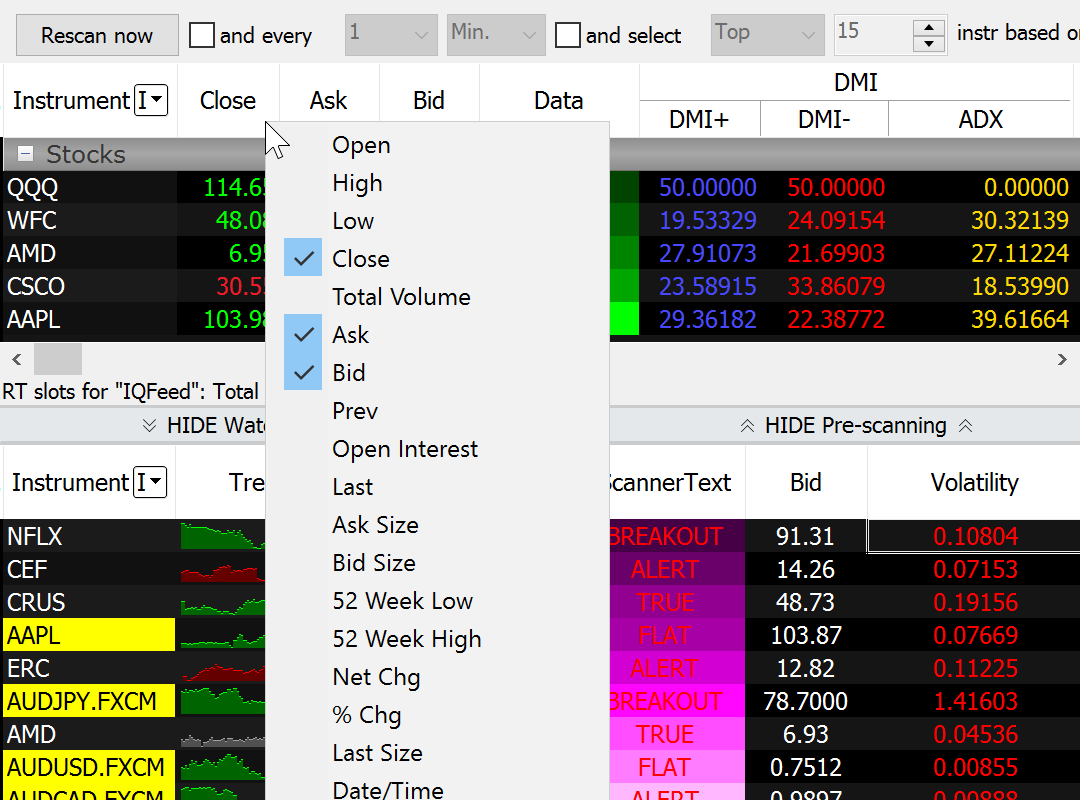
More than 20 important data fields
Open, High, Low, Close, Total Volume, Bid, Ask, Open Interest and other important data fields can be removed and added in seconds.
MultiCharts
MultiCharts
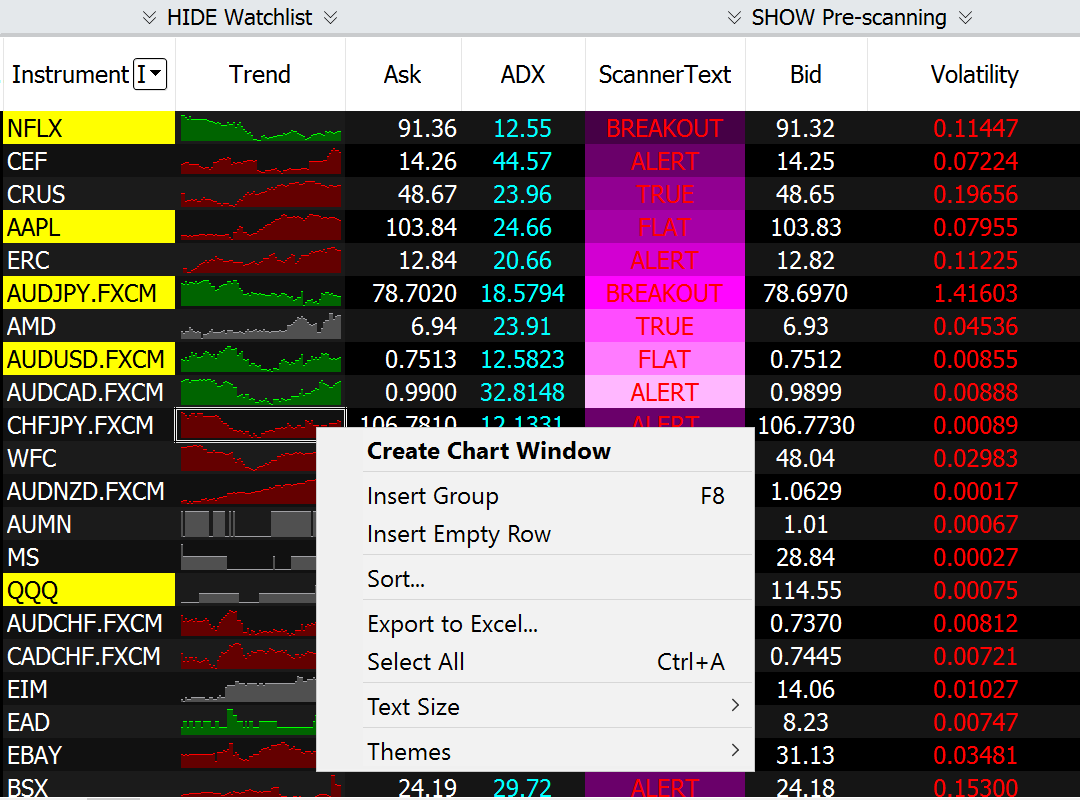
View a chart with one click
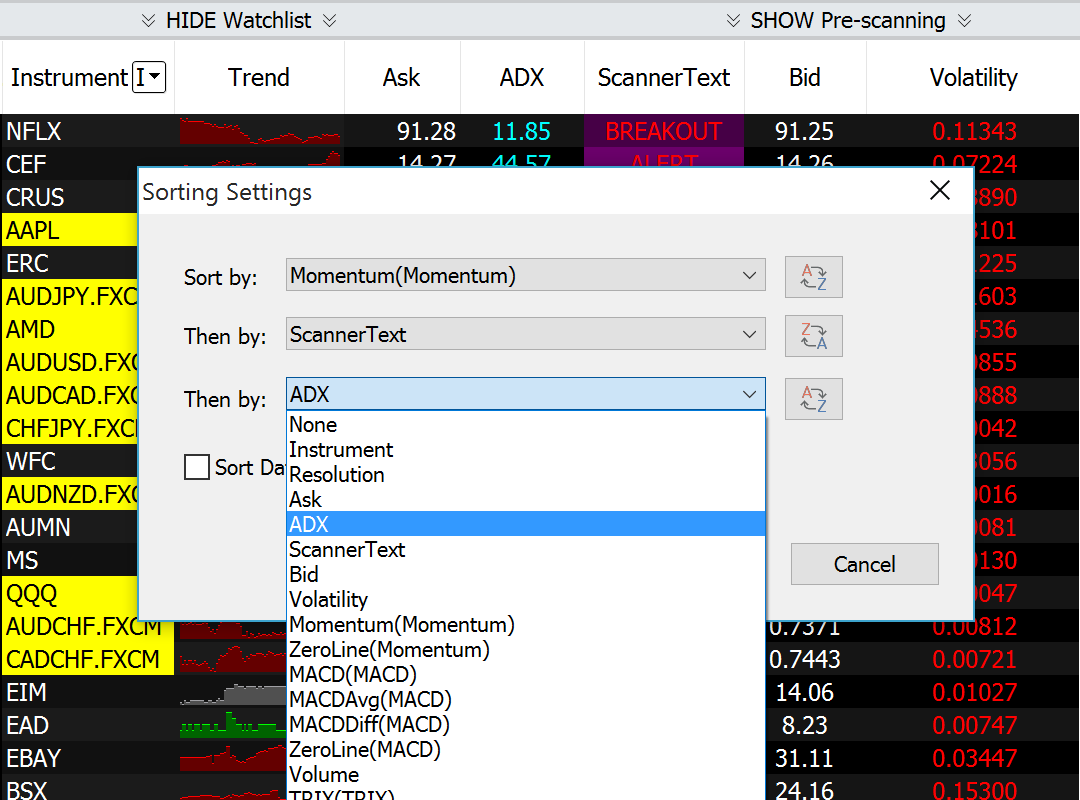
Scanner can automatically re-sort symbols either on a per-second basis or by a user-defined timer. Since you can sort according to any criteria available, this will help find trading opportunities in a timely fashion.
Scan and sort with ease
Open, High, Low, Close, Total Volume, Bid, Ask, Open Interest and other important data fields can be removed and added in seconds.
MultiCharts
Lots of data all in one place
Monitor thousands of real-time or end-of-day symbols in each Scanner window. You can even mix instruments with different resolutions and from different data feeds.
MultiCharts
Built to minimize your computer’s efforts
Since our Real-Time Market Scanner was built to use modern multi-threading architecture, it can use multi-core and multi-CPU computers to their full potential. This allows you to create very CPU-intensive workspaces with thousands of instruments and watch them in real-time without gaps or lags.
See the big picture
You can use different resolutions in different rows. For example, you could have the same symbol in tick, minute and day resolutions to monitor different trends. For even more flexibility each row can have its own session template and a unique number of bars a study will reference.
64-bit version removes all memory limitations
The 64-bit version of MultiCharts can take advantage of powerful computers to the fullest extent by using all available memory. This means you can add a lot more than 10,000 symbols per scanner window, making it a much more powerful tool.
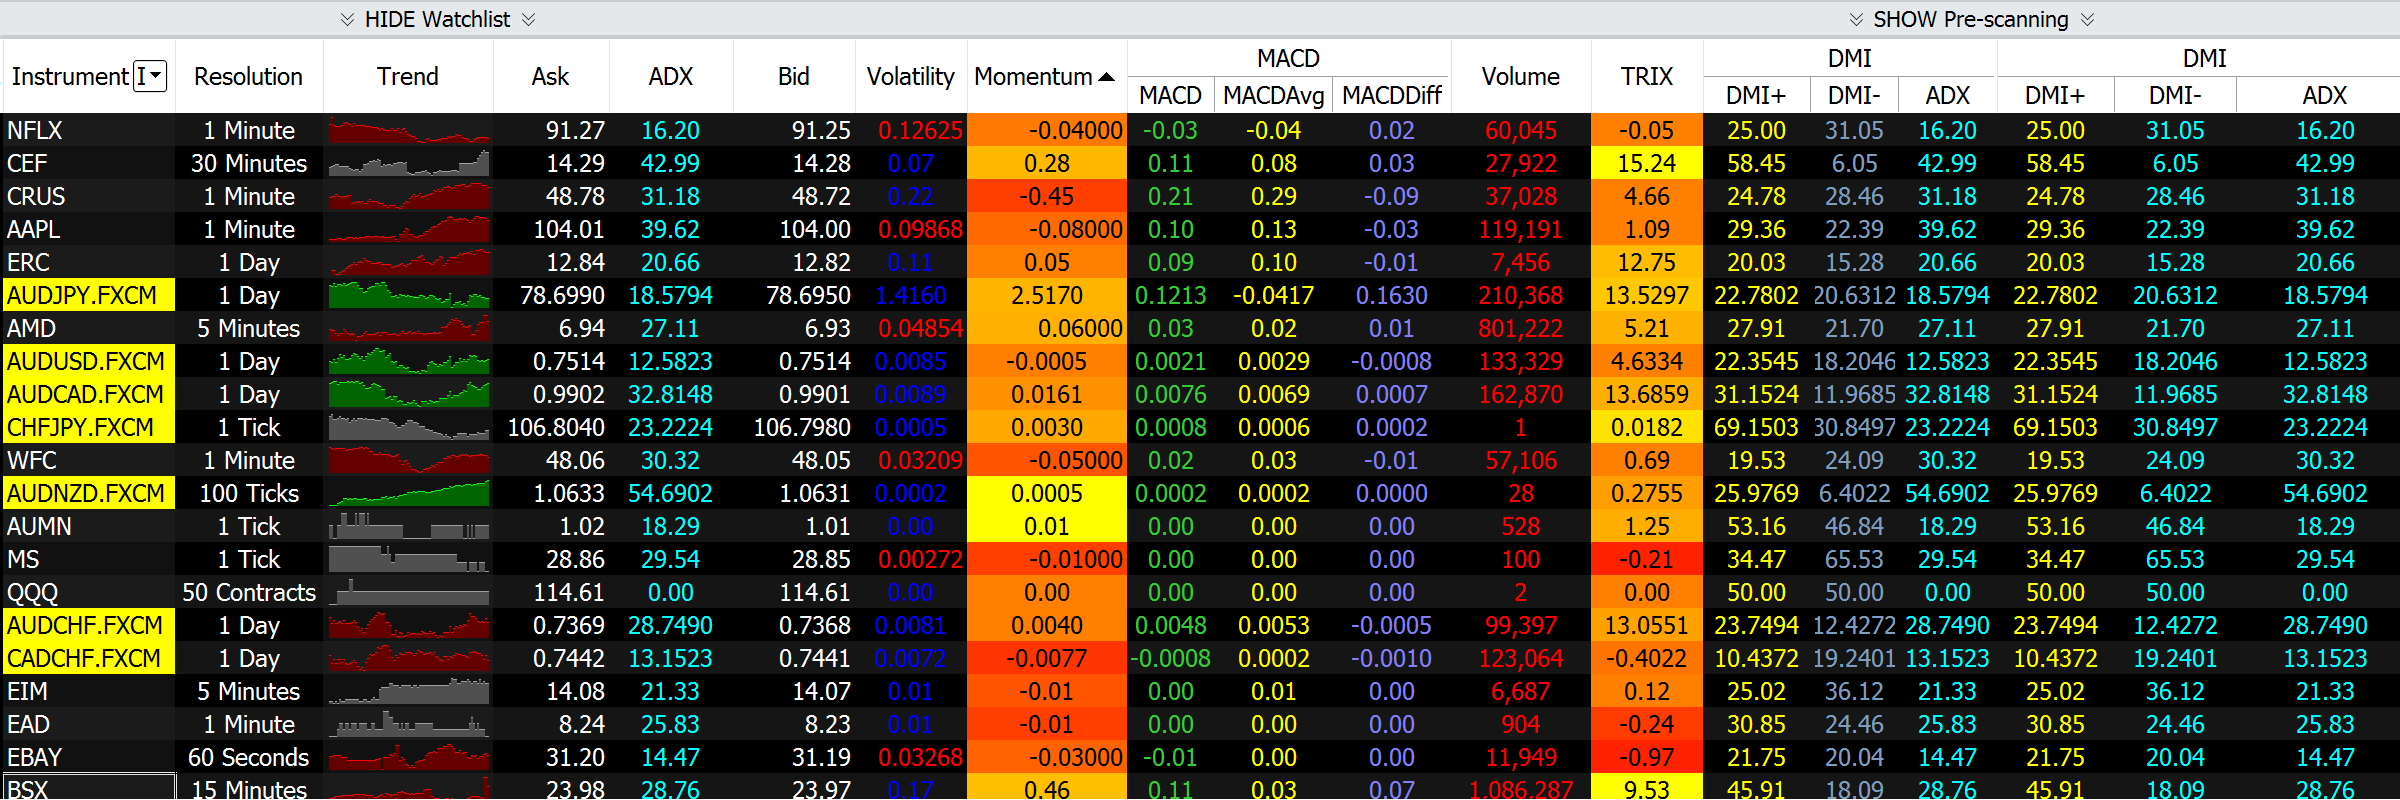
Apply hundreds of indicators
In addition to hundreds of studies that come with the trading platform, you can create your own, change existing ones and import from a variety of sources. Scanner’s distinctive feature is that you can change cell background and text coloring based on your personal criteria, and even have script-driven text generation in the Scanner cells.
MultiCharts
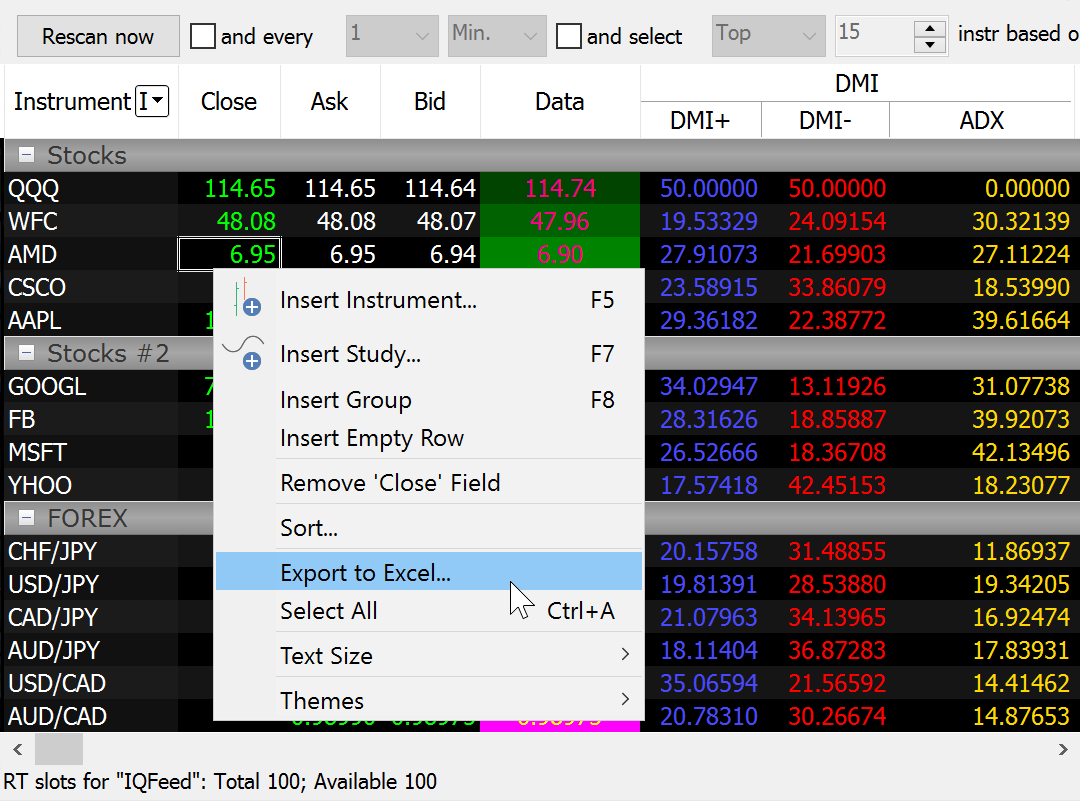
Export to Excel with one click
After finding the necessary symbols in the large list, sometimes it’s necessary to export data you find to Excel. MultiCharts can do this with one click.
MultiCharts
MultiCharts
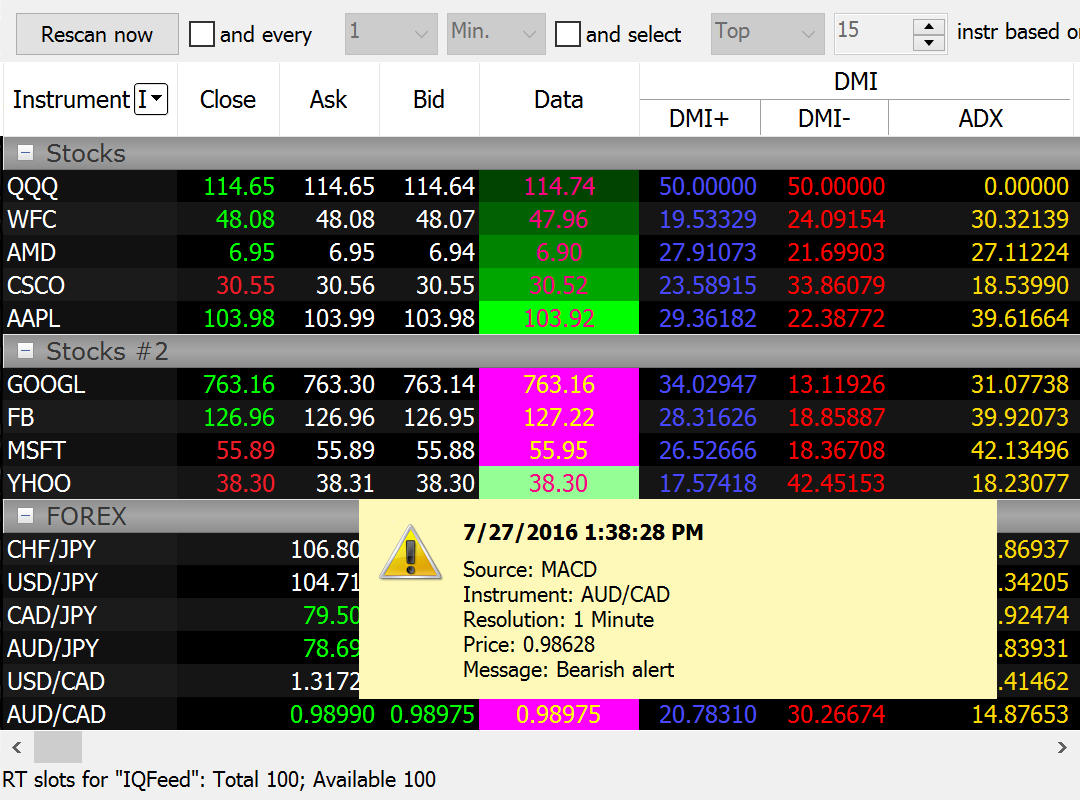
Alerts that keep you informed
You can create custom visual, sound, and email alert for one or all symbols. Scanner alerts work the same as they do on regular charts.
Group symbols for easy viewing
You can visually group symbols according to any criteria. An important distinction of having a group is that sorting is realized within each individual group. This means you can select important sectors of the industry, or interesting stock groups, and see which one tops the others. Groups can also be minimized and restored at will.
MultiCharts