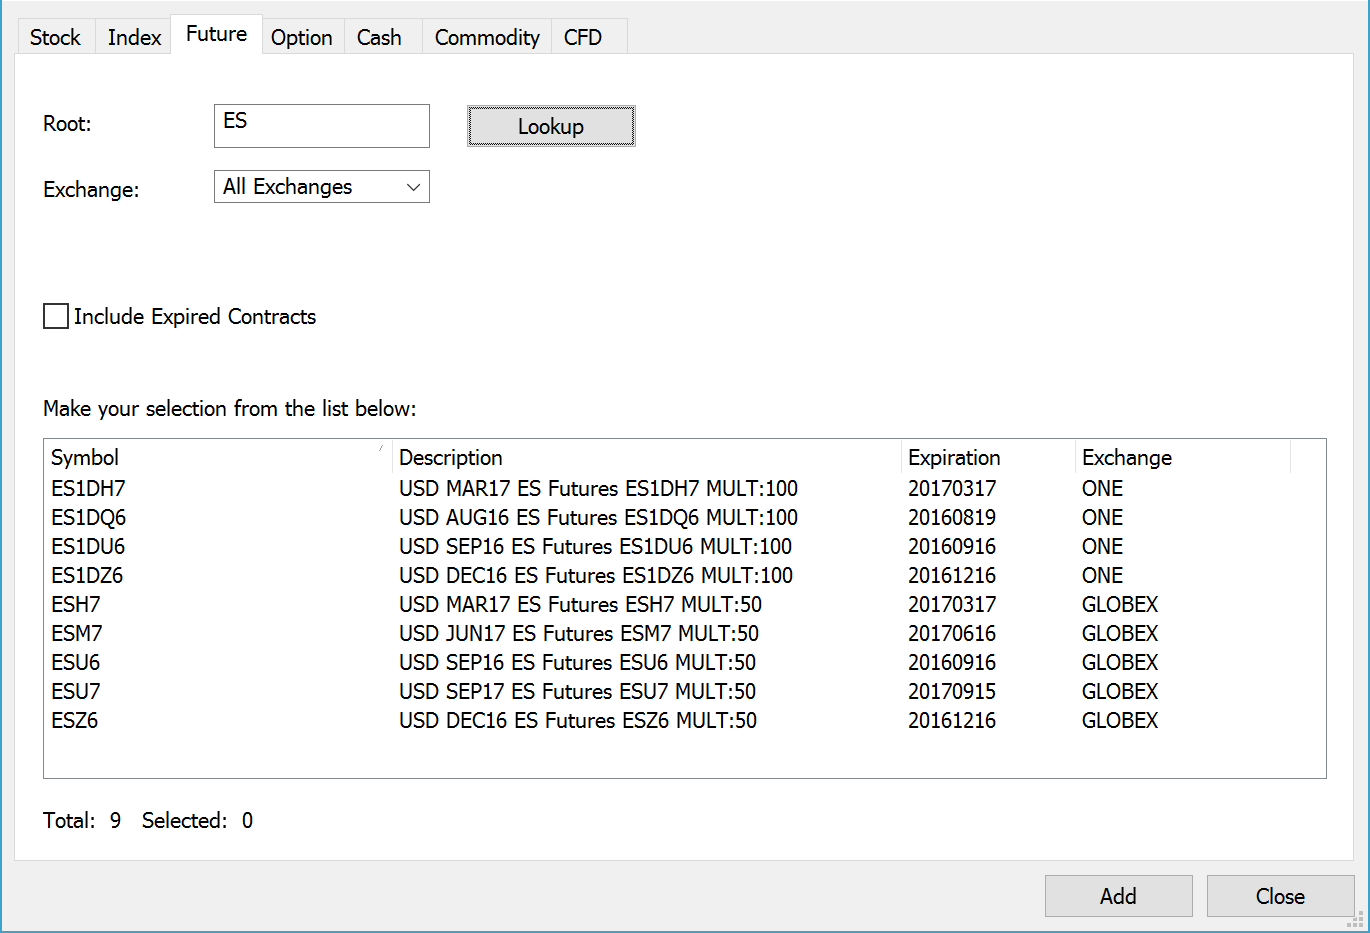
Look up symbols with ease
Symbol Lookup is a very convenient tool provided by some data feeds (not all). These lists allow you to search for a symbol by a part of its name or its description. The data vendor will then show you all matching symbols, and you can add the ones you need to your database. Some data providers that MultiCharts supports don’t offer this feature. This means you will have to add each symbol manually. You will need to input the symbol name, data source, category and exchange that match data feed specifications — so that MultiCharts knows which data to request and where to get it from. You can get this information on the data feed websites.
Insert Symbols Into Portfolio
MultiCharts QuoteManager
Easily map third-party ASCII data files
ASCII files are text files with quotes from third- party data sources. ASCII mapping is different from ASCII import. Import is a one-time update, and it has to be done manually. MultiCharts’ ASCII mapping feature will automatically update your charts whenever the text file is updated with new quotes. Every time you create a chart with a mapped symbol, MultiCharts automatically calls up the file and plots the data.
Custom session templates that suit any trading style
MultiCharts comes with many pre-configured session templates for most major market sectors. However, you can change the session template at any of three different levels— chart level, symbol level and exchange level.
Use MultiCharts online or offline
The usual mode is online, which means MultiCharts downloads missing historical data from data feeds. However, you can choose to work offline if you don’t have an internet connection — or for testing purposes. In the offline mode, MultiCharts will use locally stored data and you can use it to work on strategies and perform chart analysis.
Import and export data with ease
Data is often provided in the form of ASCII (text) files. MultiCharts can import third-party ASCII files and export locally stored data into the ASCII format. There are often slight formatting variations in ASCII files from different providers. For example, some use commas for separating information, while others use semicolons. MultiCharts can automatically convert most formats.
Edit your data with a couple of clicks
The locally stored data can be viewed and edited. For example, you can find and correct bad ticks quickly and easily. You can also add new data or delete existing data from your system.
Fill any gaps in your data
Any gaps in the locally stored data are automatically filled by downloading missing historical data from your data feed. The process is highly efficient because it only grabs the data you need, as opposed to reloading all data for the entire period. This feature can also be disabled if you don’t want to use it.
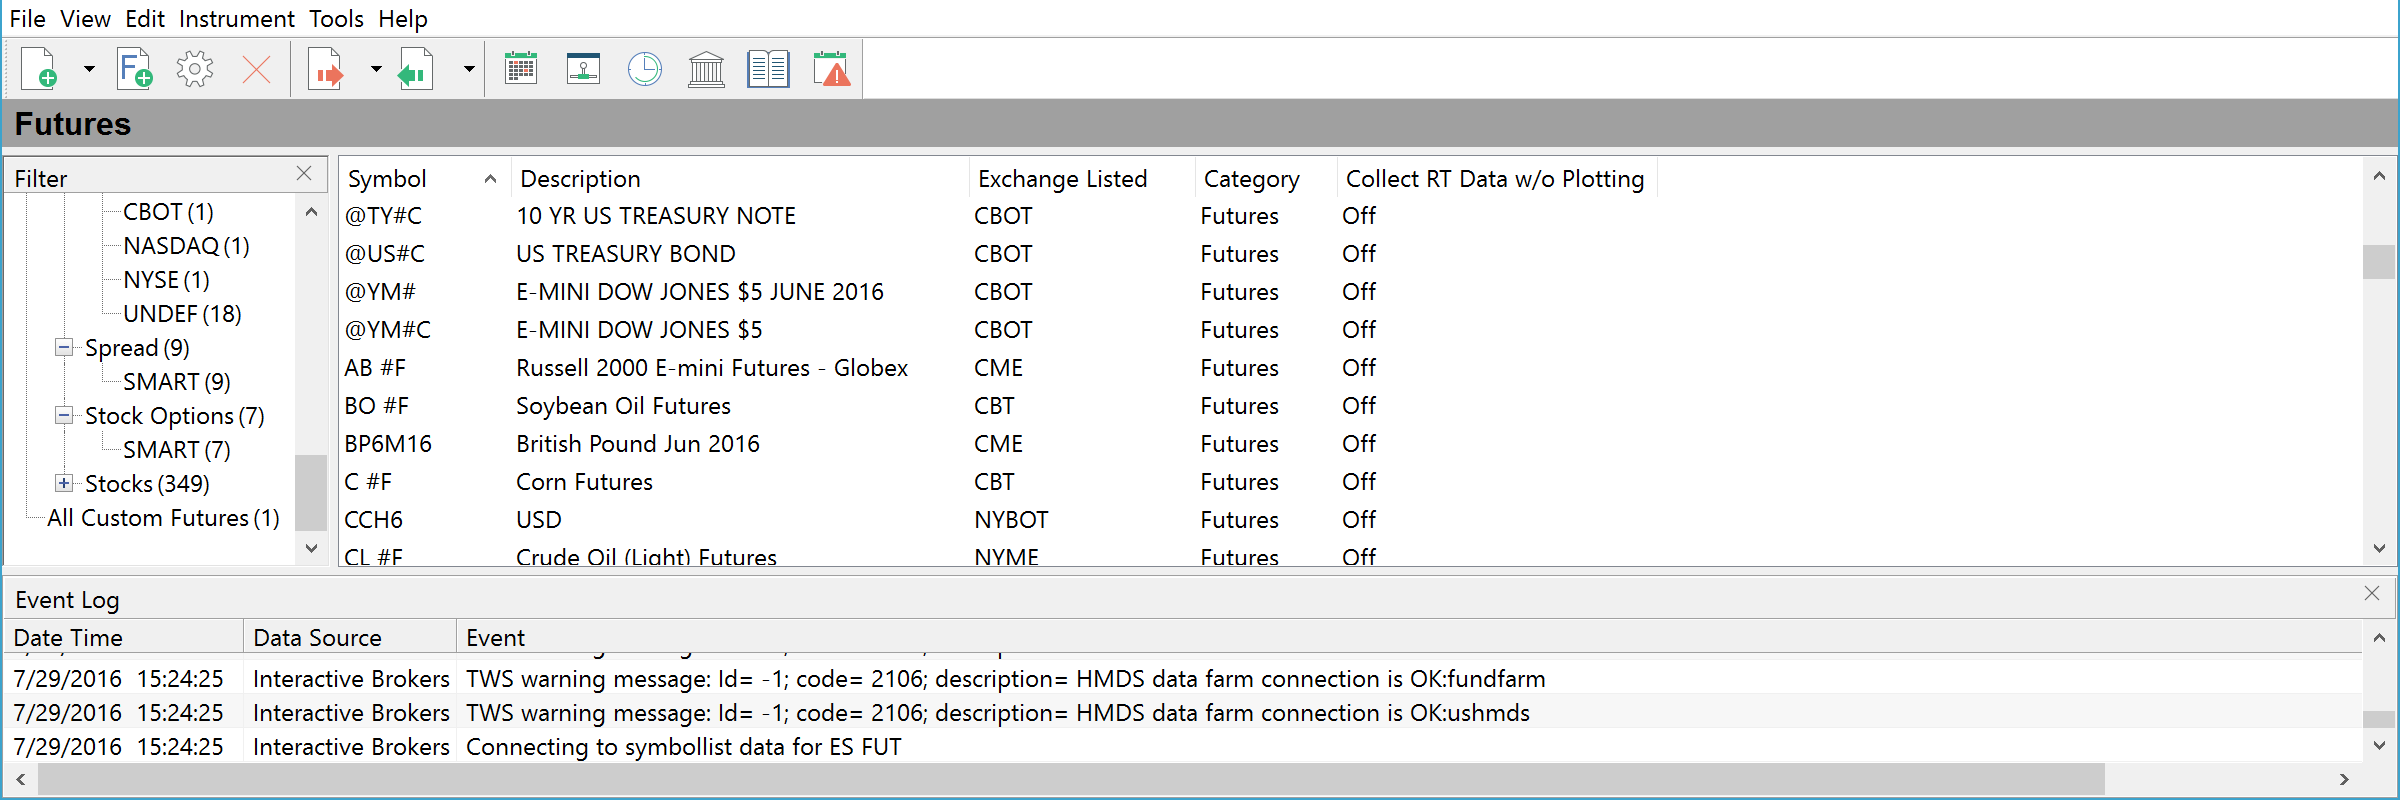
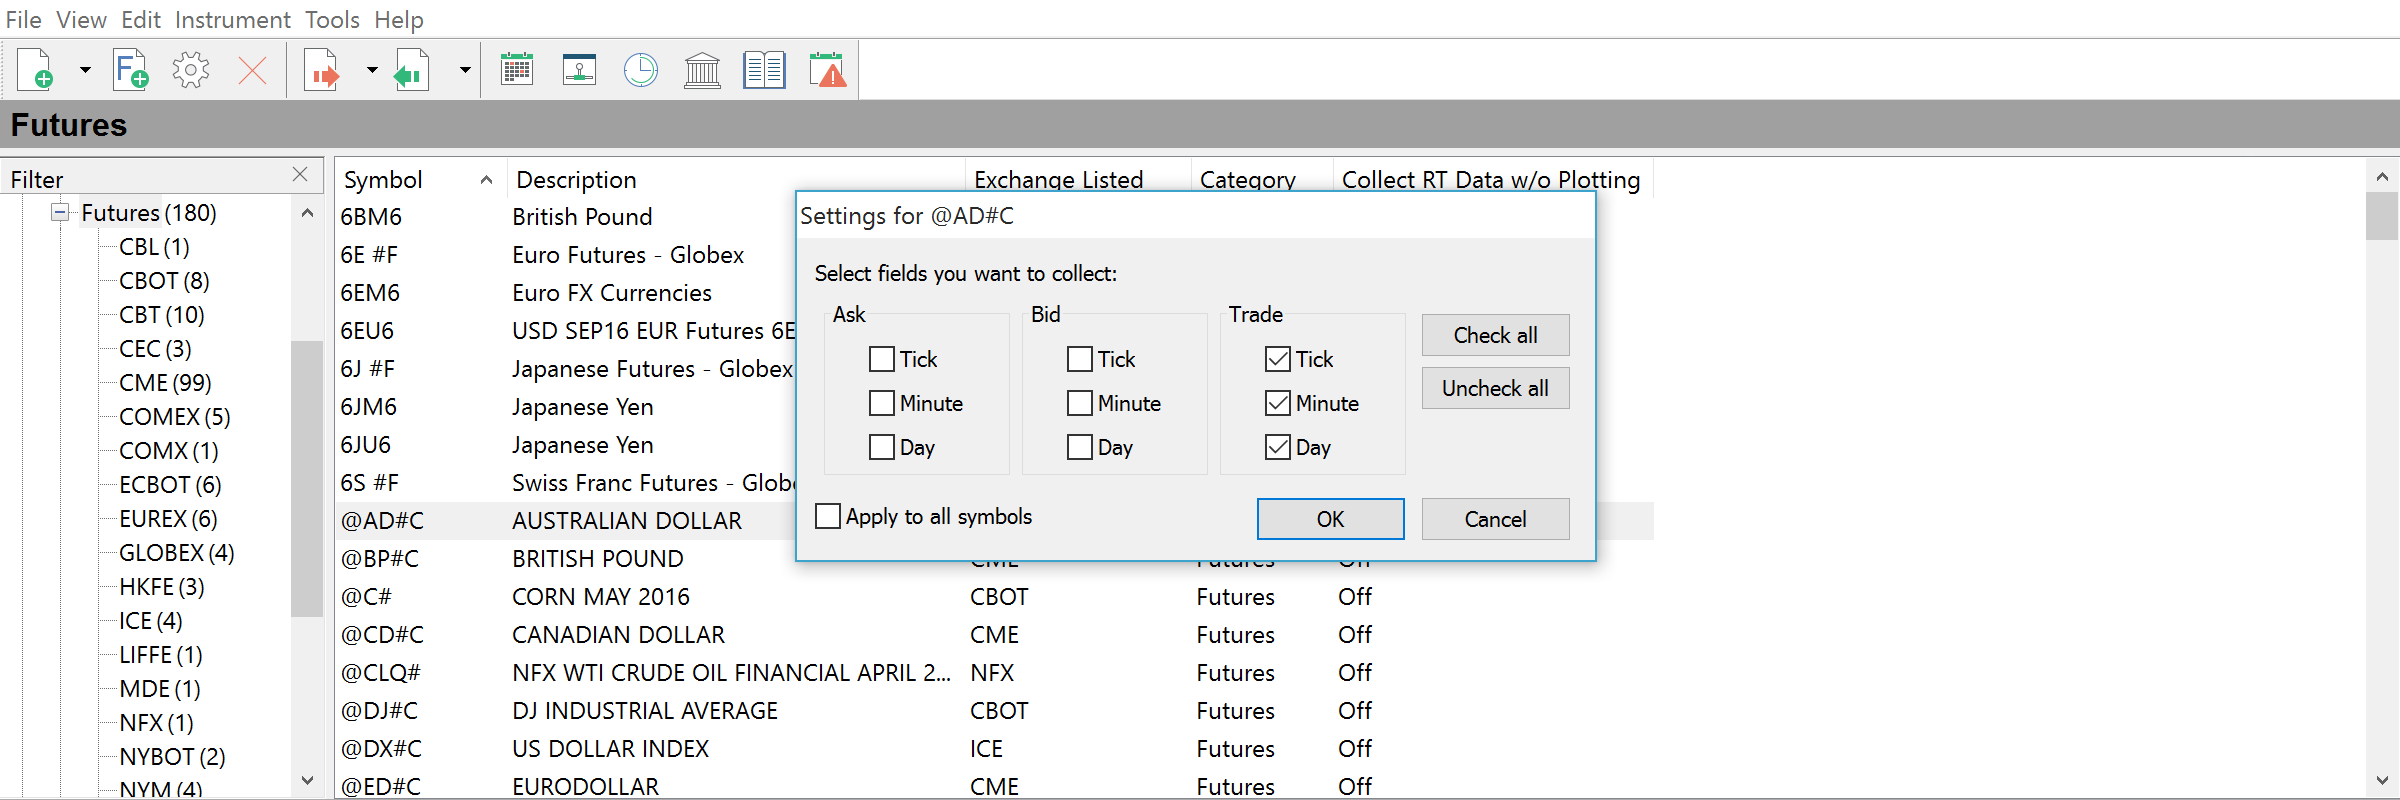
Collect real-time data without making a chart
Usually data is only loaded and stored in the local database when you make a chart. This type of on-demand data loading prevents your computer from becoming congested. However, the QuoteManager can collect real-time data for symbols that you choose and store it locally, even without making a chart. This is useful when there is no immediate need to plot the symbol, but the symbol’s data must still be stored. A good example is when your data feed does not provide historical data, so you need to build up your own supply. The stored data can be used later as historical data for creating charts.
MultiCharts QuoteManager
Exchanges & ECNs

Edit Exchange & ECN

Easily modify exchange and ECN settings
You can use default settings for sessions or customize details such as price scale, time zone, big point value and minimum price movement.
Merge two data providers in the same chart
You can use two separate data sources in one chart—one for historical data and one for real-time data. This advanced feature resolves the situation where a broker provides real-time data but not historical data. For example, Google and Yahoo (combined under the name Free Quotes in MultiCharts) offer free historical daily data. You can make a chart using this data source and merge it with real-time data from Interactive Brokers. More info on our Wiki.
Data Management