Andrews' Pitchfork
This drawing tool helps predict the support and resistance areas in a trending market. It consists of three parallel lines—usually drawn from three consecutive major peaks or troughs.
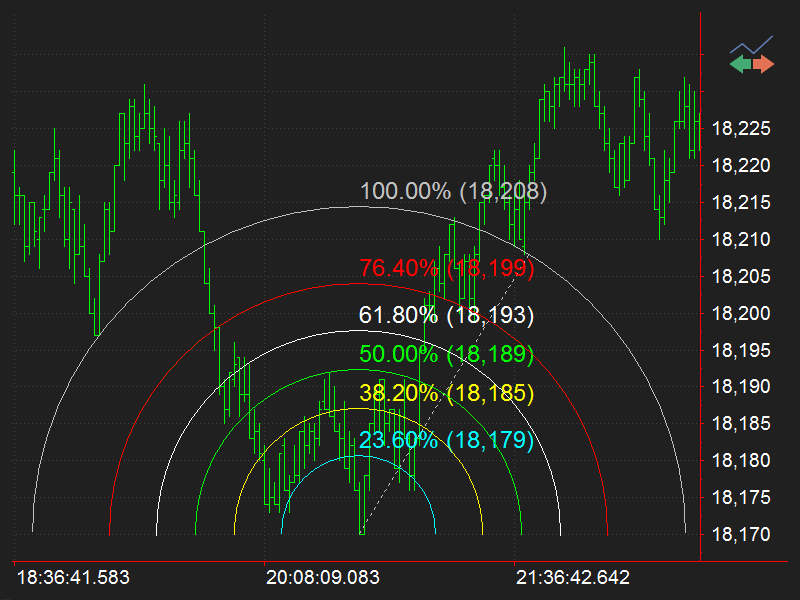
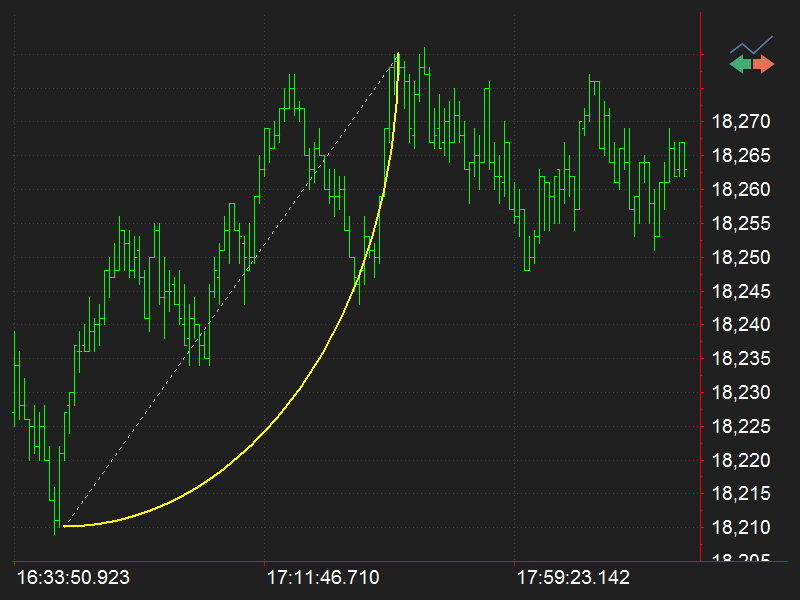
Fibonacci Speed/Resistance Arc
This analytical drawing tool determines the direction and speed of trend reversal, and it indicates support and resistance levels. You can draw up to 11 arcs based on any selected distance percentages as well as Fibonacci percentages.
Fibonacci Speed/Resistance Fan
This analytical drawing tool indicates support and resistance levels of an existing trend and the price level at which possible changes in the trend may occur. You can draw up to 11 lines based on any selected distance percentages as well as Fibonacci percentages.
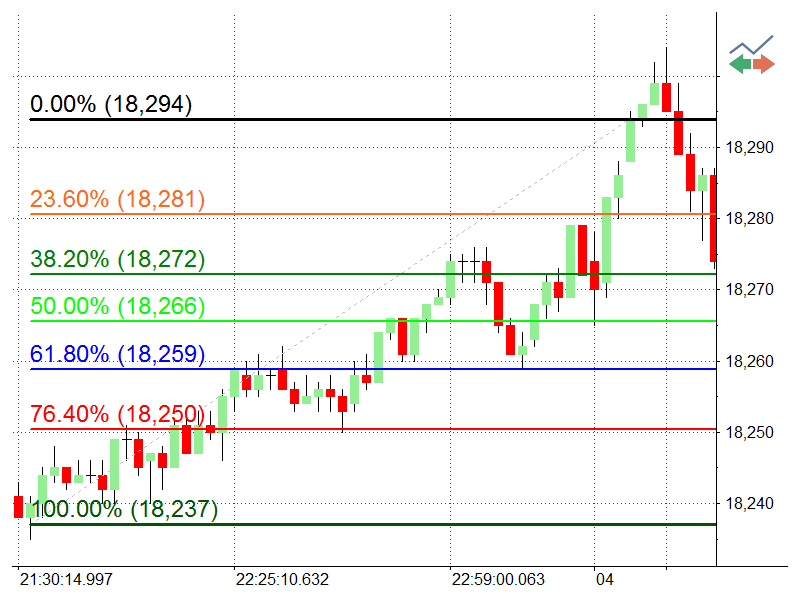
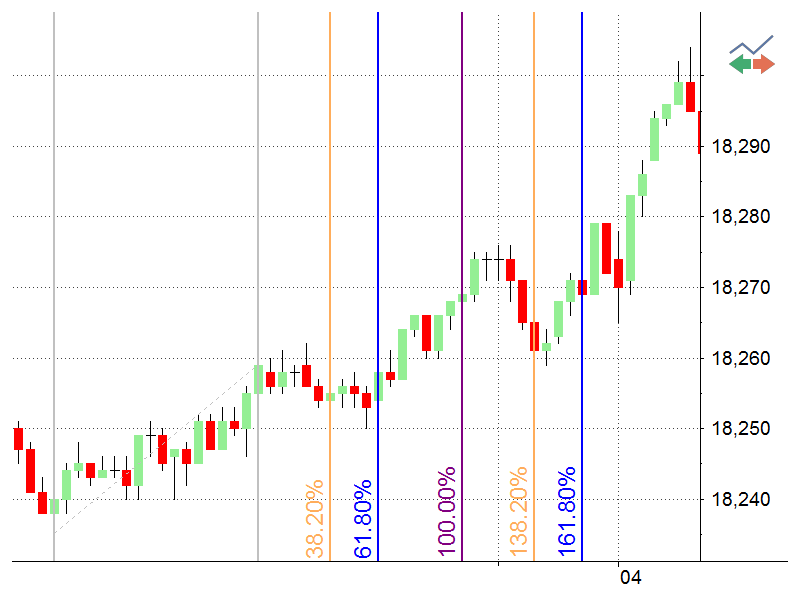
Fibonacci Retracement
This analytical drawing tool examines support and resistance levels, as well as price breakouts. It is represented by a series of horizontal lines that intersect the trend line (drawn between two extreme points) at the Fibonacci levels or selected distance percentages.
Fibonacci Trend-Based Time Lines
This analytical drawing tool predicts future price corrections and examines support and resistance levels, as well as price breakouts. It is represented by a series of vertical lines at date and time levels, which show probable price corrections in the existing trend.
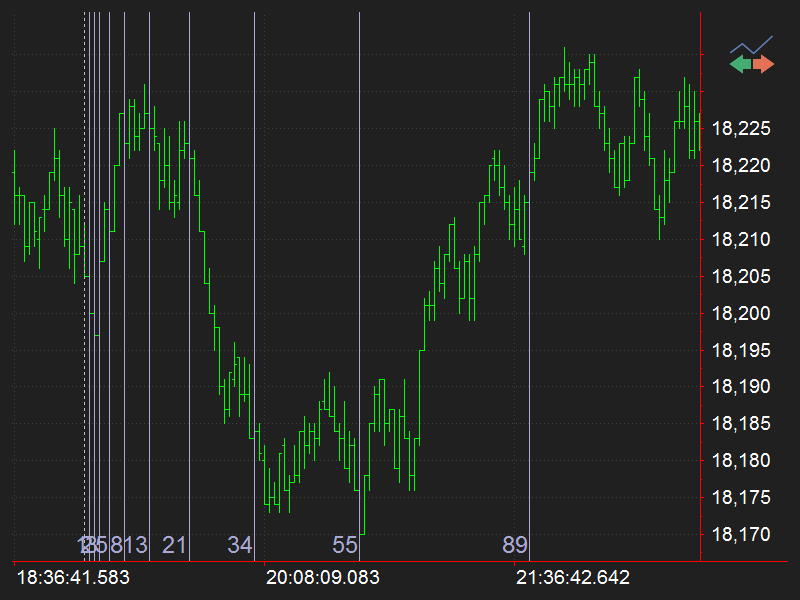
Fibonacci Time Zones
This analytical drawing tool is represented by a series of vertical lines, and it indicates significant price movements near them. These vertical lines are spaced according to the Fibonacci number sequence (0, 1, 1, 2, 3, 5, 8, 13, 21, 34, 55, 89, …).
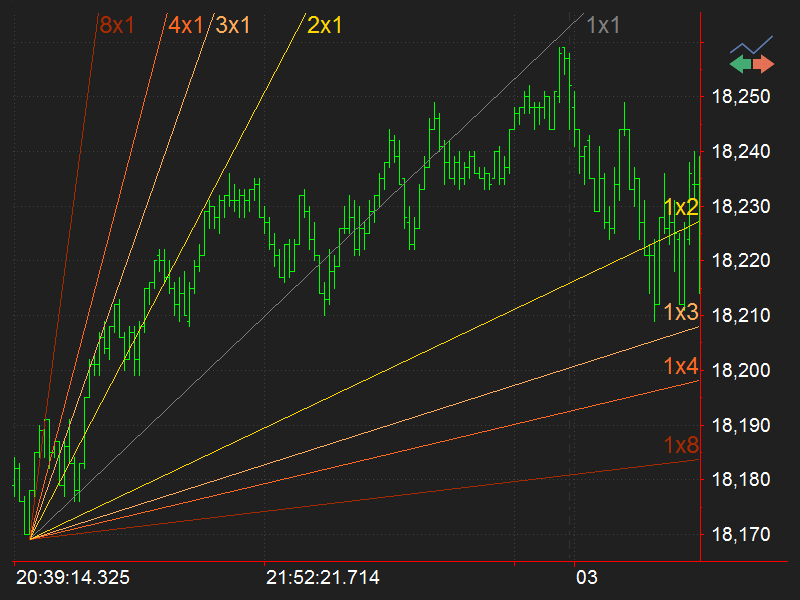
Gann Fan
This analytical drawing indicates time and price movements from important highs and lows, and it identifies price breakouts. Angled lines fan out from the selected point. They indicate a time-to-price relationship that may be relatively fast or relatively slow, depending on the size of the Gann angle.
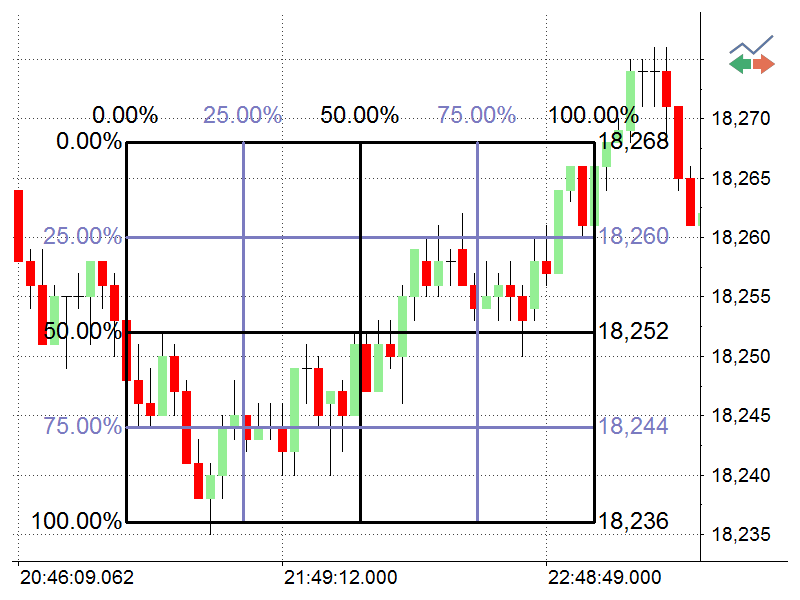
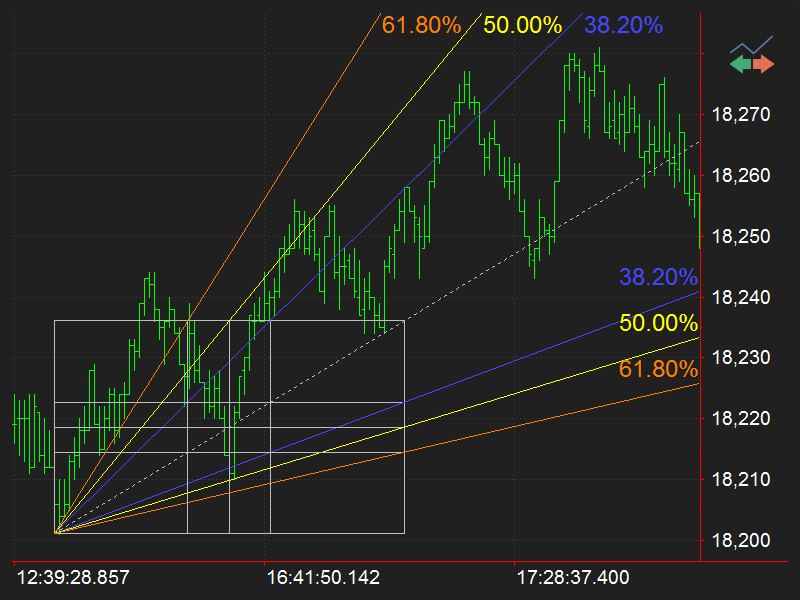
Gann Square
The Gann Square is created by drawing a Gann Fan from each corner of a square.
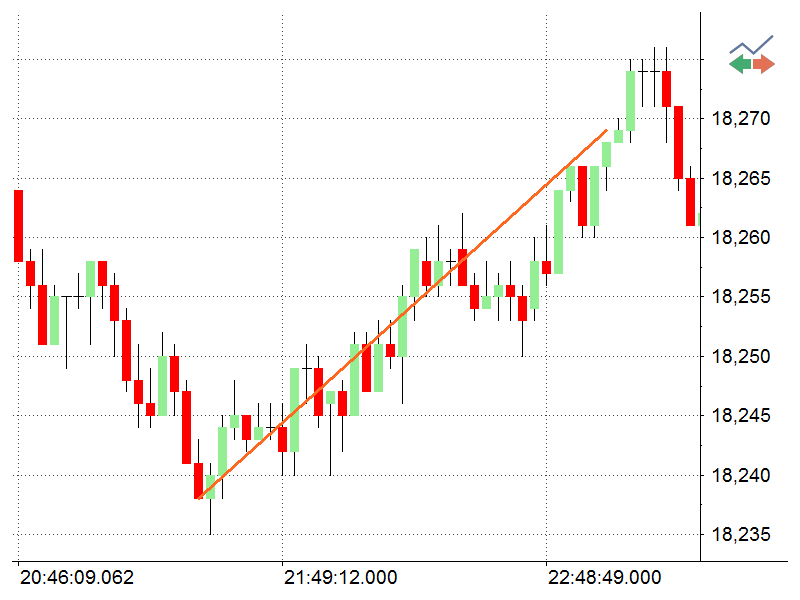
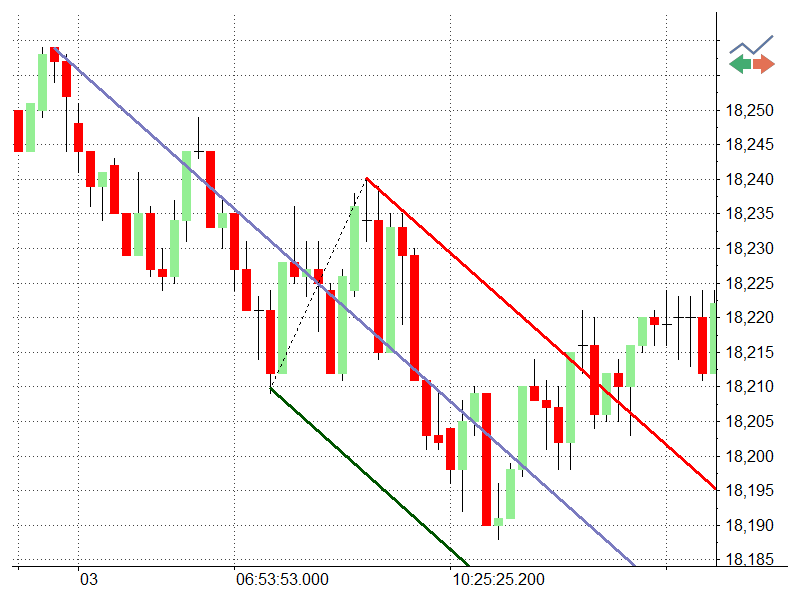
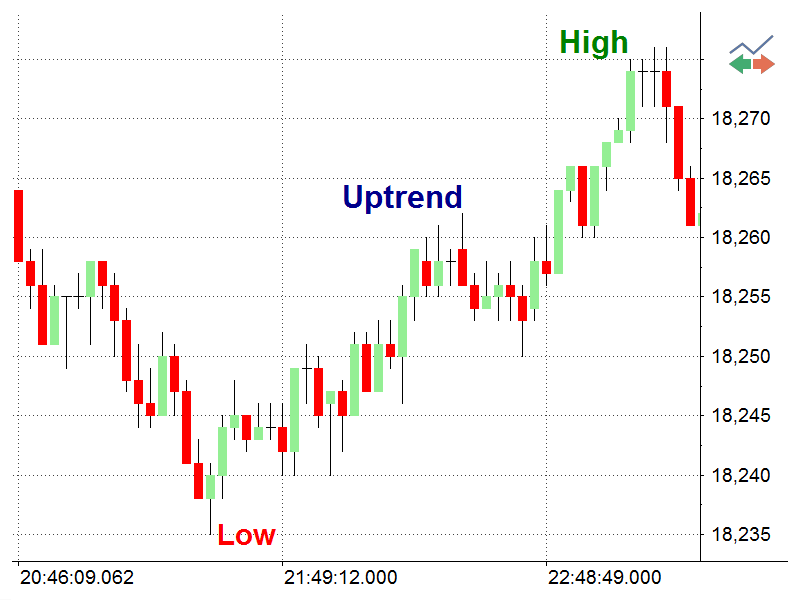
Trend line
This analytical drawing tool indicates the direction of price movement.
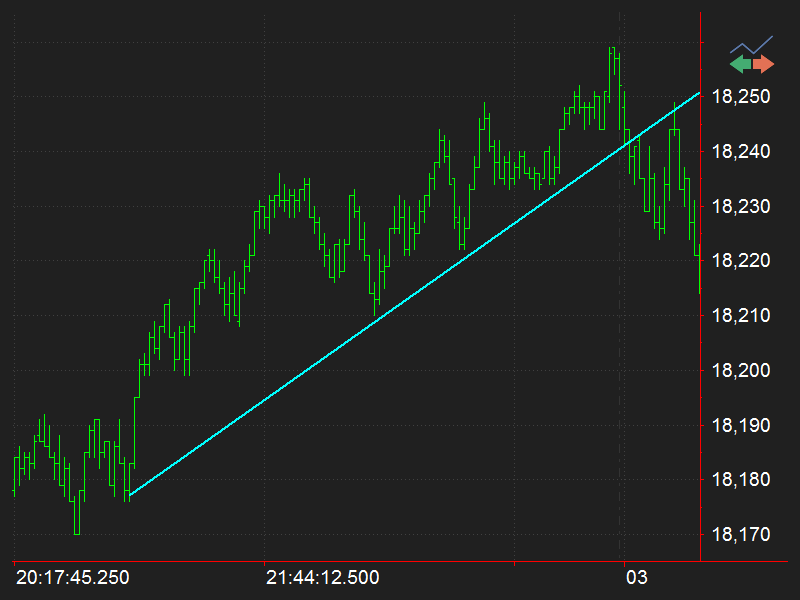
Extended Line
This analytical drawing tool indicates past and future directions of price movement. This is a trend line that extends left and right on the chart.
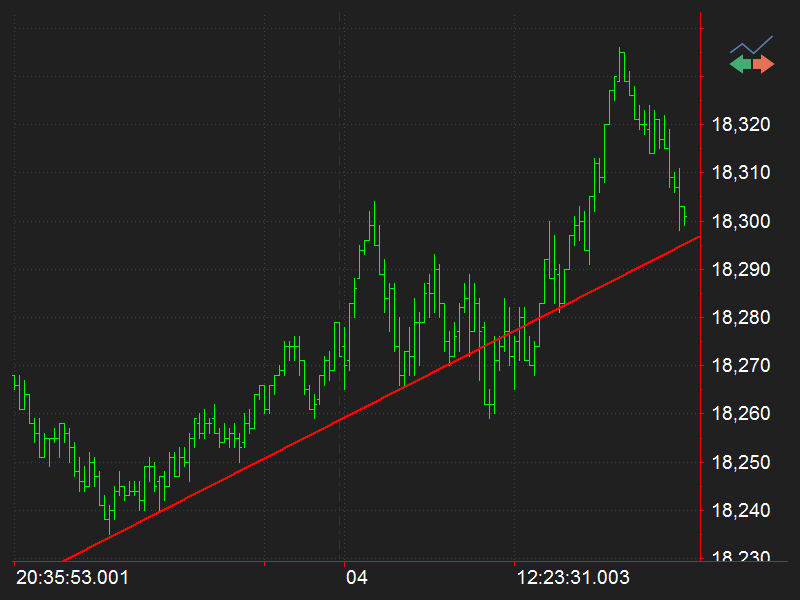
Ray Line
This analytical drawing tool indicates possible future direction of price movement. This is a trend line that can only be extended to the right.
Text
Text is a non-analytical drawing tool used to display user comments, and other text, directly on the chart.
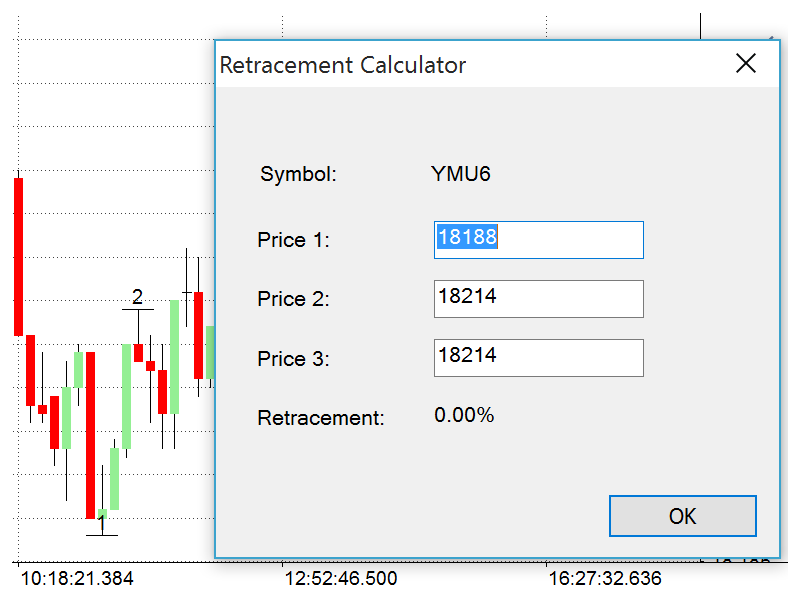
Retracement Calculator
This analytical drawing tool predicts future price corrections and examines support and resistance levels, as well as price breakouts. It is represented by a series of vertical lines at date and time levels, which show probable price corrections in the existing trend.
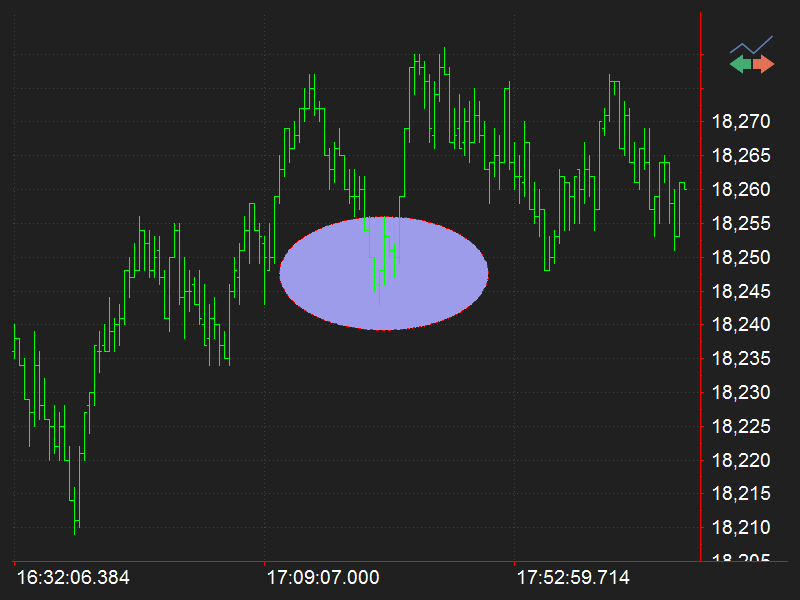
Ellipse
This is a non-analytical drawing tool for highlighting the necessary parts of a chart.
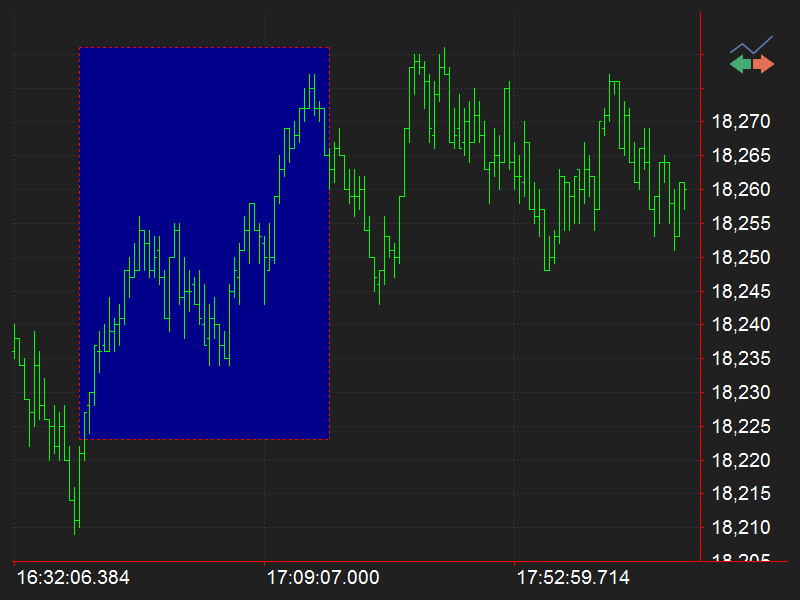
Rectangle
This is a non-analytical drawing tool for highlighting the necessary parts of a chart.
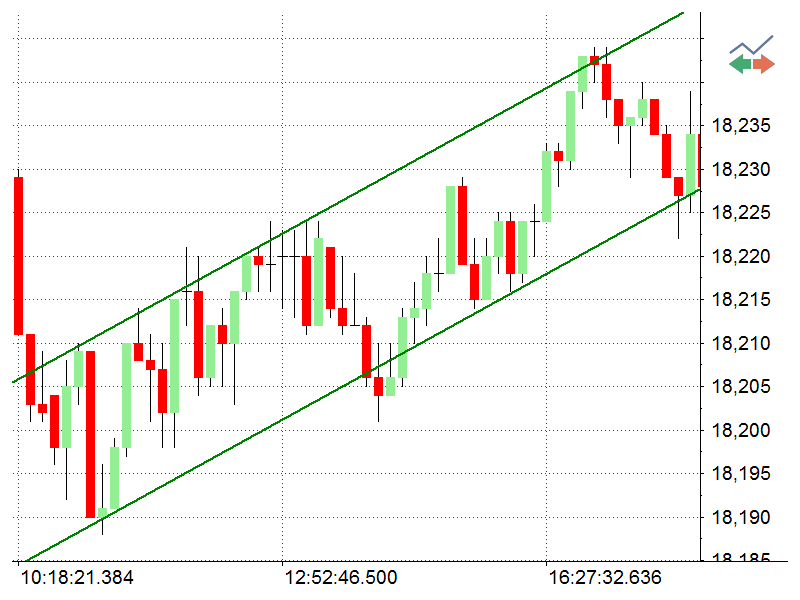
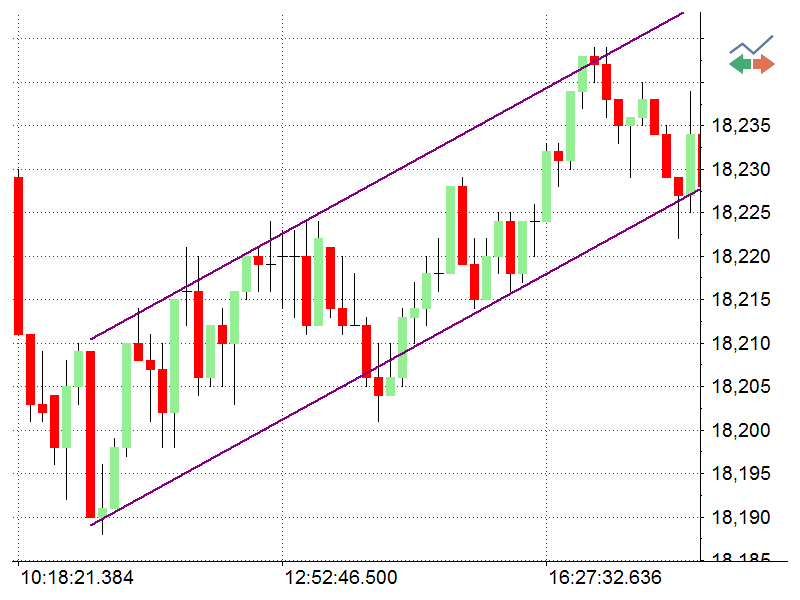
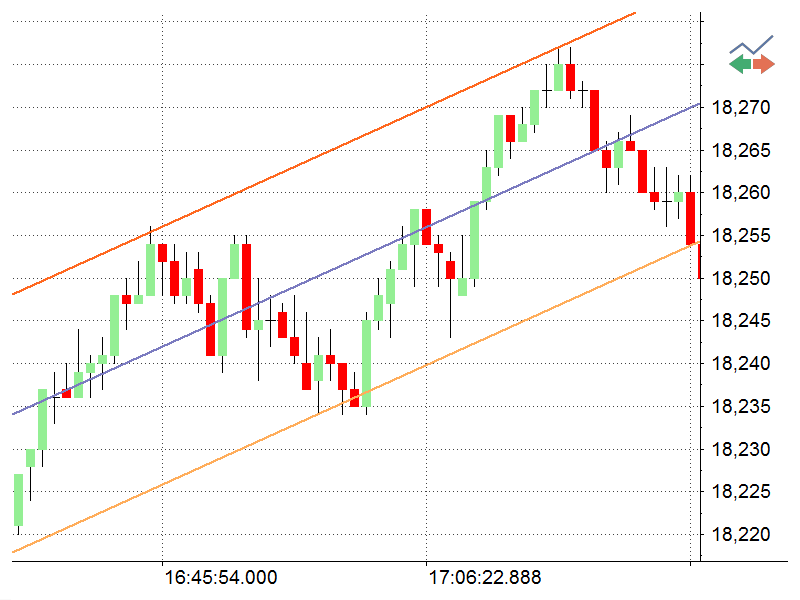
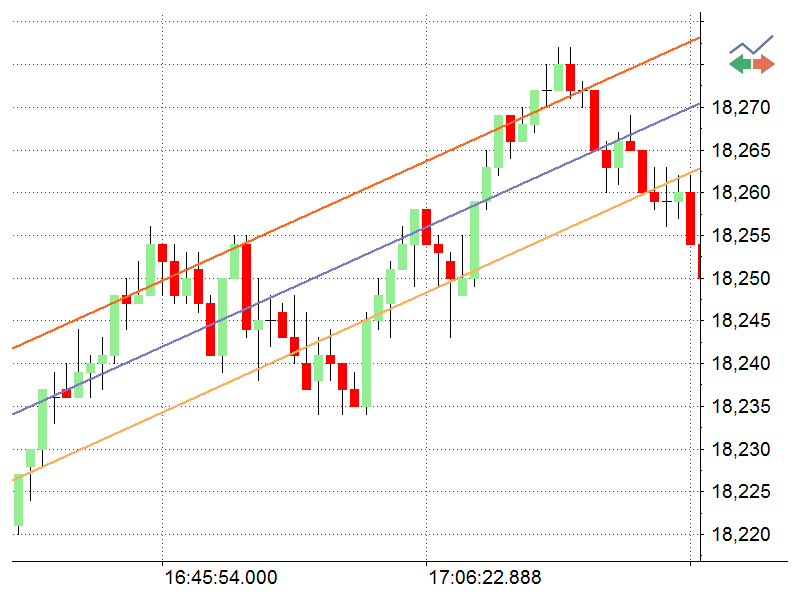
Extended Parallel Lines
This analytical drawing tool draws parallel trend lines that are extended to the left and right on the chart. They outline the equidistant channel in which the market trades. The upper horizontal line is the resistance line. The lower horizontal line is the support line. If either of these lines is penetrated, a price breakout may occur.
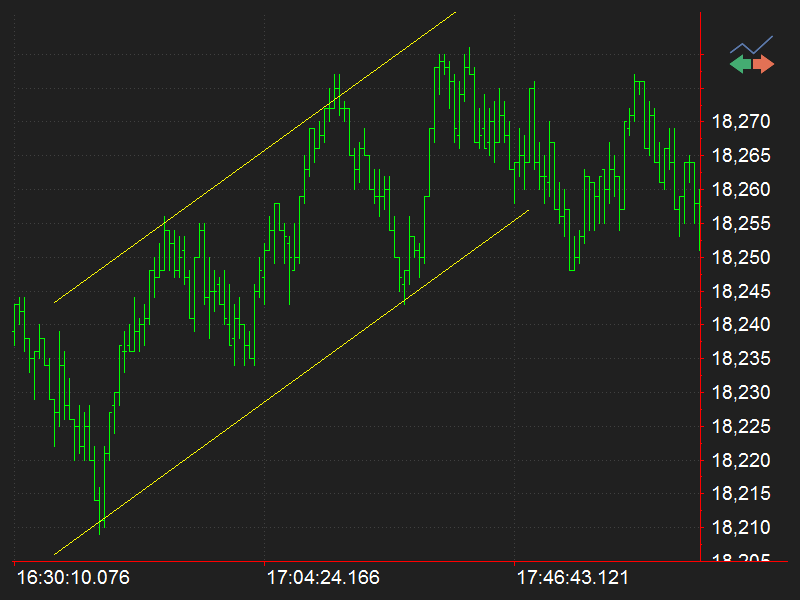
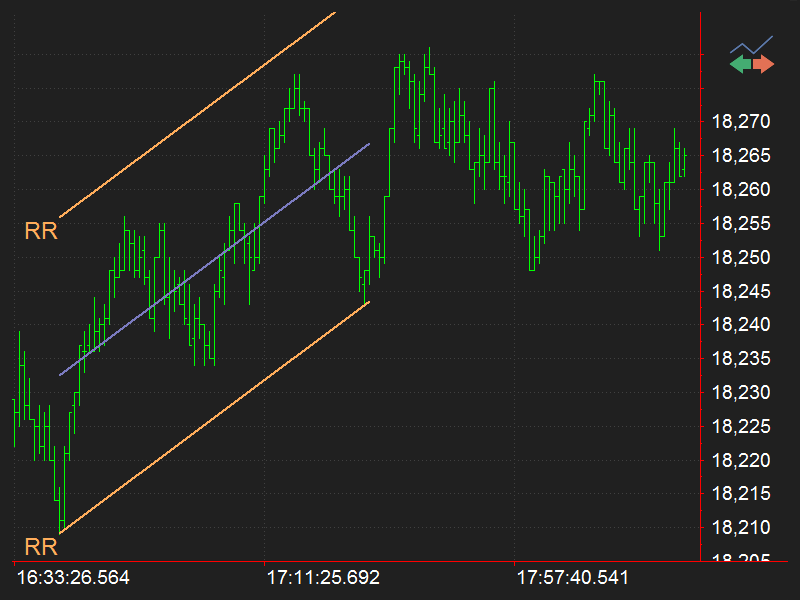
Ray Parallel Lines
This analytical drawing tool draws parallel trend lines that are extended to the right only. They outline the equidistant channel in which the market trades.
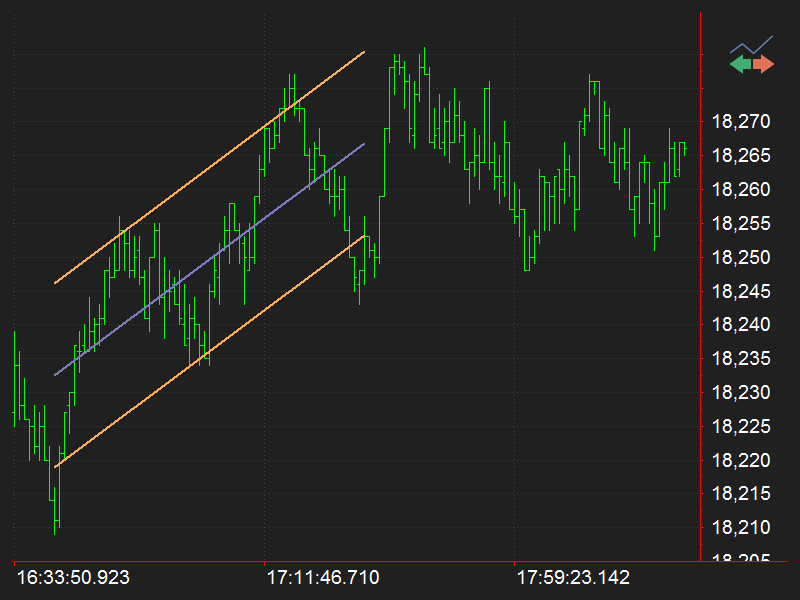
Parallel Lines
This is a pair of parallel lines that outline the equidistant channel in which the market trades.
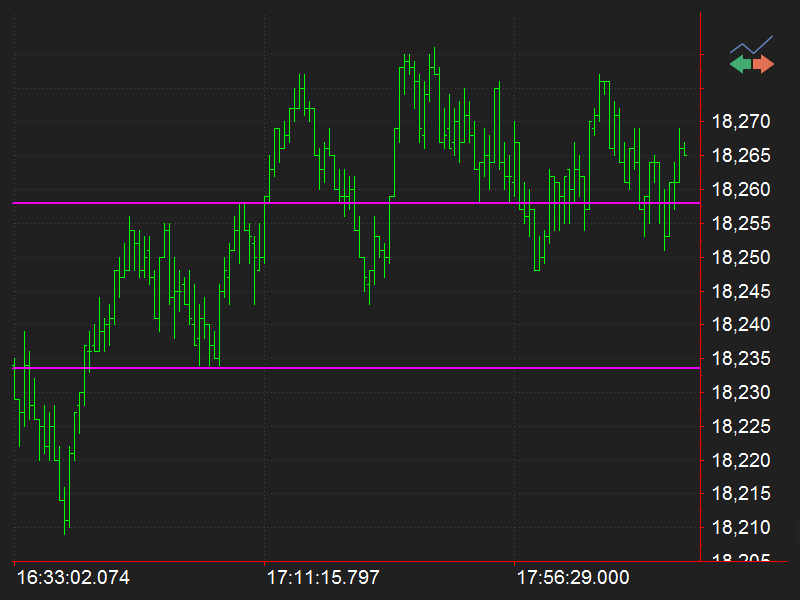
Horizontal Parallel Lines
This is a pair of horizontal parallel lines that outline the equidistant channel in which the market trades.
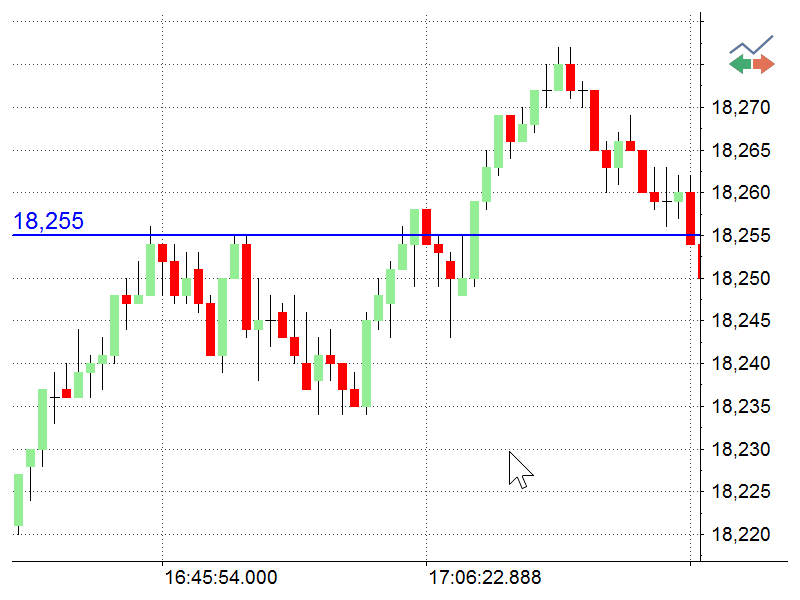
Horizontal Line
This analytical drawing tool indicates a particular price level. You can draw more than one in order to mark support and resistance levels.
Regression Channel - Segment High-Low
This is a channel based on a regression line, which is calculated from open, high, low, and close values. The upper line is based on the highest value for the period and the lower line on the lowest value. The outer bounds outline the equidistant channel in which the market trades.
Regression Channel - Standard Deviation
This analytical drawing tool shows two parallel equidistant lines based on a specified number of standard deviations and is drawn above and below the regression line.
Regression Channel - Raff Regression
Gilbert Raff developed this analytical drawing tool, and it precisely defines a price trend and its support and resistance levels. It is represented by two parallel equidistant lines drawn above and below the linear regression line, and it is based on the maximum upward and downward oscillation.
Regression Channel - Standard Error
This analytical drawing tool shows two parallel equidistant lines based on a specified number of standard deviations and is drawn above and below the regression line.
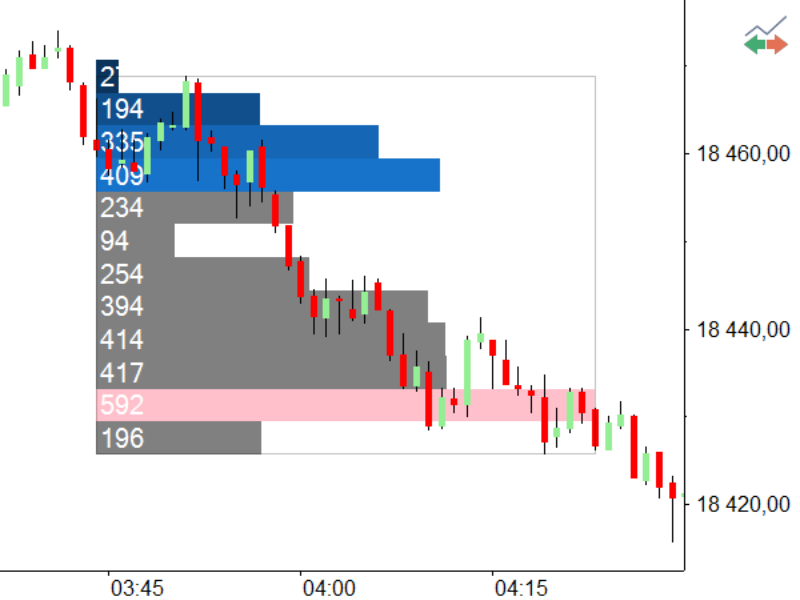
Volume Profile
This analytical drawing tool inserts Volume Profile as a drawing. It tracks trading activity volume across different price levels and varying time lengths.
Arc
This is a non-analytical drawing tool that looks like an arched line, and it’s used for highlighting necessary chart segments. Arcs can be drawn at any angle.