Hello
Is it possible to draw a rectangle using Easylanguage in indicator?
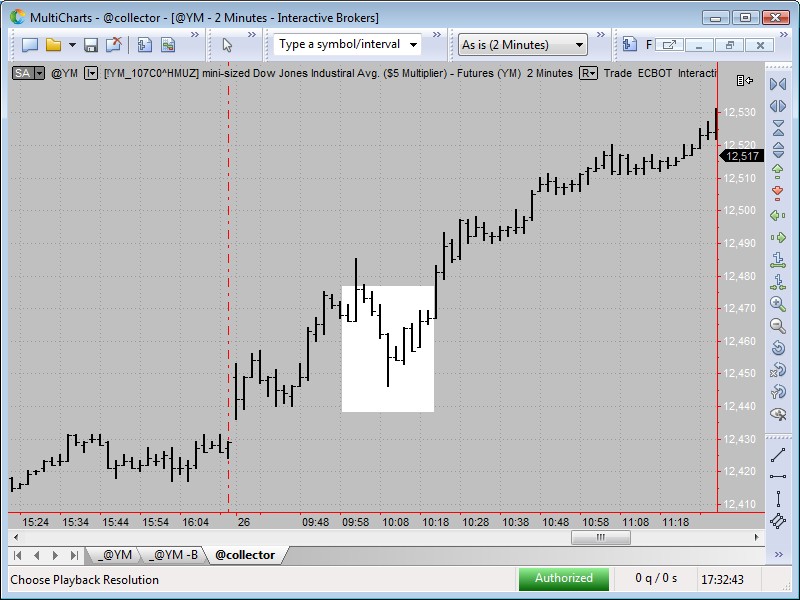
I'm looking to draw a rectangle and modify the interior depending of some condition. My idea is to keep the rectangle in syncs with the chart and expand it with the apparition of a new bar.
Martin
Using Easylanguage to draw a rectangle
-
TJ

- Posts: 7751
- Joined: 29 Aug 2006
- Location: Global Citizen
- Has thanked: 1033 times
- Been thanked: 2228 times
Re: Using Easylanguage to draw a rectangle
57.51.39
viewtopic.php?f=1&t=6894
not exactly the answer you want...Hello
Is it possible to draw a rectangle using Easylanguage in indicator?
I'm looking to draw a rectangle and modify the interior depending of some condition. My idea is to keep the rectangle in syncs with the chart and expand it with the apparition of a new bar.
Martin
viewtopic.php?f=1&t=6894
-
TJ
- Posts: 7751
- Joined: 29 Aug 2006
- Location: Global Citizen
- Has thanked: 1033 times
- Been thanked: 2228 times
Re: Using Easylanguage to draw a rectangle
from your chart, it looks like all you need is to draw a straight line that extends to the end.Hello
Is it possible to draw a rectangle using Easylanguage in indicator?
I'm looking to draw a rectangle and modify the interior depending of some condition. My idea is to keep the rectangle in syncs with the chart and expand it with the apparition of a new bar.
Martin
Re: Using Easylanguage to draw a rectangle
A tl_rectangle function would be nice if MC could implement it. It is easier to modify the colors, style, width, ... and to delete the rectangle if you have only one ID like with text or trendlines.
Should we add this to the features requests?
Should we add this to the features requests?
Re: Using Easylanguage to draw a rectangle
Hello SP
I did try to work with trendline. For The trendline function
" Value1=TL_New_s(Sdate,Stime,Sprice,Edate,Etime,Eprice);"
we need to provide a starting (date, time, Price) and Ending (date, Time, Price).
No success yet. Nothing is displayed. That's only a part of my quest as i want to color the interior of this given "trend line"
Of course it could be add to a request.Should we add this to the features requests?
I did try to work with trendline. For The trendline function
" Value1=TL_New_s(Sdate,Stime,Sprice,Edate,Etime,Eprice);"
we need to provide a starting (date, time, Price) and Ending (date, Time, Price).
No success yet. Nothing is displayed. That's only a part of my quest as i want to color the interior of this given "trend line"
Code: Select all
Variable:

New_Date (0),

sDate	(0),

Stime (0),

Sprice (0),

Edate (0),

Etime (0),

Eprice (0);


If barstatus = 2 then begin

 If o = 1.4557 and h = 1.45585 and l = 1.4539 then begin // Only a Selection of a bar to start drawing a test trend line

 	print (close:5:5);						//  Simple confirmation that i got the good bar

 	Sdate = Date;

 	Stime = Time;

 	Sprice = Open;

 	Edate = Date;

 	Etime = 1648;                         // Time bar where the test trend line should finish

 	Eprice = Close;

 	Value1=TL_New_s(Sdate,Stime,Sprice,Edate,Etime,Eprice);

 	Print (value1:5:5);

 	Print ("Sdate: " , Sdate:8:0);

 	Print ("Stime: ",  Stime:8:0);

 	Print ("Sprice:", Sprice:5:5);

 	Print ("Edate:", Edate:8:0);

 	Print ("Etime:", Etime:8:0);

	Print ("Eprice:", Eprice:5:5);


 end;

end;


Martin
-
TJ
- Posts: 7751
- Joined: 29 Aug 2006
- Location: Global Citizen
- Has thanked: 1033 times
- Been thanked: 2228 times
Re: Using Easylanguage to draw a rectangle
you can give this a try...
- Attachments
-
- Rectangle demonstration.txt
- (586 Bytes) Downloaded 618 times
-
- rectangle demonstration.jpg
- (112.95 KiB) Downloaded 1270 times
Re: Using Easylanguage to draw a rectangle
YES!A tl_rectangle function would be nice if MC could implement it. It is easier to modify the colors, style, width, ... and to delete the rectangle if you have only one ID like with text or trendlines.
Should we add this to the features requests?
Re: Using Easylanguage to draw a rectangle
The attached plots Darvis Boxes, using trend lines it may be helpful.
- Attachments
-
- Darvis Box.TXT
- (6.19 KiB) Downloaded 614 times