Hi Folks, i am looking for the indicator Super-Trend for Multicharts.net. Can someone help me?
Thank you.
Frank
Supertrend
-
JoshM

- Posts: 2196
- Joined: May 20 2011
- Location: The Netherlands
- Has thanked: 1544 times
- Been thanked: 1565 times
- Contact:
Do you might have a link to the source code of the SuperTrend version you're looking for? A quick Google search shows multiple SuperTrend indicators (TS SuperTrend, ana SuperTrend, SuperTrend M11, SuperTrend U11, and the 'default' SuperTrend).
I have only this of TS2000. (sorry Google Translator) 
Frank
-----------------------------
INPUT: LENGTH (21), CONST(4);
vaR: SWITCH(1), TR(0), ARC(0), SAR(0),HISIC(0),LOSIC(0);
TR= VOLATILITY (LENGTH);
ARC= TR* CONST;
IF CURRENTbar = length then begin
hisic=typicalprice;
losic=typicalprice;
if h>= xaverage (h,length-1) [1] then begin
hisic= highest(typicalprice,length);
Sar=hisic-arc;
switch= 1;
end;
if l <= xaverage (l,length-1) [1] then begin
losic= lowest (typicalprice,length);
sar = losic +arc;
switch=0;
end;
end;
if switch =1 then begin
if typicalprice>hisic then hisic=typicalprice;
sar=hisic - arc;
if typicalprice< sar then begin
switch=0;
losic=typicalprice;
sar = losic + arc;
end;
end;
if switch=0 then begin
if typicalprice< losic then losic=typicalprice;
sar= losic +arc;
if typicalprice> sar then begin
switch=1;
hisic=typicalprice;
saR=HISIC- ARC;
END;
END;
IF C > SAR { AND C[1] < SAR } THEN begin
Plot1(SAR,"V1");
if _DStoc(10)<6 then begin
setplotcolor(1,cyan);
alert ("L O N G - E N T R Y" +" "+ numtostr((high+low)/2,2));
end;
end;
IF C < SAR { AND C[1] > SAR} THEN begin
Plot2(sar,"V1");
if _DStoc(10)>94 then begin
setplotcolor(2,magenta);
alert ("S H O R T - E N T R Y" +" "+ numtostr((high+low)/2,2));
end;
end;
--------------------------------------
-
JoshM
- Posts: 2196
- Joined: May 20 2011
- Location: The Netherlands
- Has thanked: 1544 times
- Been thanked: 1565 times
- Contact:
Hi Frank,
Since I don't have TS2000, could you test to see if the attached indicator gives a similar view in MC .NET as in TS2000?
At least it looks like a SuperTrend indicator, so it's probably not totally off :
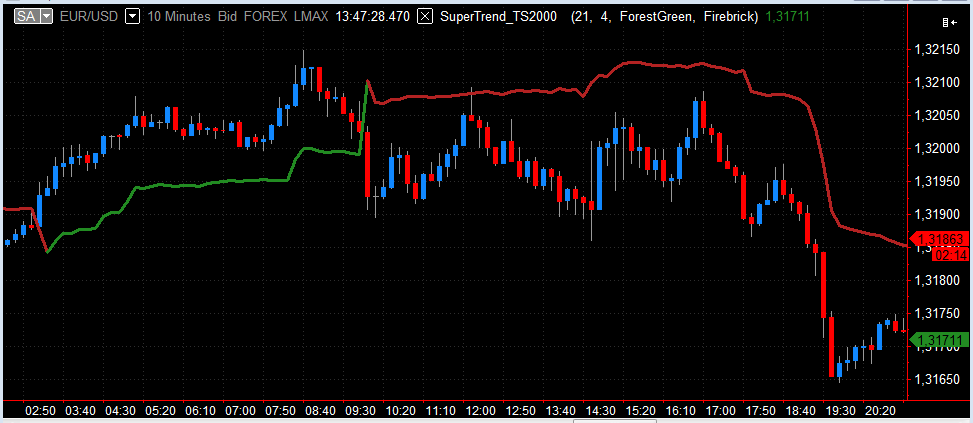
But there might be some differences due to the following:
* Since the TS2000 'volatility' function was not included, I've used the `Volatility` function from PowerLanguage .NET. There might be differences between these two;
* This SuperTrend indicator has no alerts because the TS2000 '_DStoc' function was not included.
(* And there might be differences between the platforms that influence how code is executed, but that is out of our circle of influence).
Since I don't have TS2000, could you test to see if the attached indicator gives a similar view in MC .NET as in TS2000?
At least it looks like a SuperTrend indicator, so it's probably not totally off
But there might be some differences due to the following:
* Since the TS2000 'volatility' function was not included, I've used the `Volatility` function from PowerLanguage .NET. There might be differences between these two;
* This SuperTrend indicator has no alerts because the TS2000 '_DStoc' function was not included.
(* And there might be differences between the platforms that influence how code is executed, but that is out of our circle of influence).
- Attachments
-
- supertrend_29-8-14.pln
- (2.51 KiB) Downloaded 905 times
-
- scr.29-08-2014 13.47.52.png
- (11.48 KiB) Downloaded 2387 times
Hi,
good work, I'm impressed!
I have found
Volatility:
--------------
Inputs: Length(NumericSimple);
If CurrentBar >= 1 AND Length <> 0 Then Begin
If CurrentBar = 1 Then
Volatility = TrueRange
Else
Volatility = ((Length - 1) * Volatility[1] + TrueRange) / Length;
End;
-----------
_Dstc:
----
{_DStoc: Double Stochastic}
Inputs: DStLen(NumericSimple);
Vars: Num(0),Denom(0),Ratio(0),PctK(0),DNum(0),DDenom(0),
DRatio(0),DPctK(0);
{Stoc}
Num=C-_Lst(L,DStLen);
Denom=_Hst(H,DStLen)-_Lst(L,DStLen);
Ratio=IFF(Denom>0,(Num/Denom)*100,Ratio[1]);
PctK=IFF(CurrentBar=1,Ratio,PctK[1]+(.5*(Ratio-PctK[1])));
{DStoc}
DNum=PctK-_Lst(PctK,DStLen);
DDenom=_Hst(PctK,DStLen)-_Lst(PctK,DStLen);
DRatio=IFF(DDenom>0,(DNum/DDenom)*100,DRatio[1]);
DPctK=IFF(CurrentBar=1,DRatio,DPctK[1]+(.5*(DRatio-DPctK[1])));
_DStoc=DPctK;
------------
The display is ok. I see again the weekend. Sometimes there are mistakes.
See image. Can I edit it?
I hope Google translate well! Sorry
Greetings from Berlin,
Frank
- Attachments
-
- Supertrend.gif
- (45.37 KiB) Downloaded 1630 times
-
JoshM
- Posts: 2196
- Joined: May 20 2011
- Location: The Netherlands
- Has thanked: 1544 times
- Been thanked: 1565 times
- Contact:
I thought it would be more efficient to do the Double Stochastics first, and then adjust the SuperTrend; that would at least save one revision/test cycle.
But the _Hst and _Lst functions are missing from the _DStoc code, so I can't proceed now that I have time. Do you have those functions? It would probably also help if you have the Double Stochastics indicator itself.
I did implement the TrueRange() method (based on Wikipedia, since this function was also missing) and the Volatility code today in the SuperTrend indicator.
* * * *
Edit: It's now September 16 (just over two weeks), and my offer to program these indicators has "expired" so to speak. I'm moving on to other projects. :]