Hello Arnie, about your request for % charts, here is an indicator script.
Hope it helps.
Sorry, some comments are in french, and 2 subsidiary functions need to be commented out (or rewritten using my comments__ in english) They are used only to draw arrow or small texts on charts.
% Percentage Chart (indicator)
-
Yves BENOIT

- Posts: 30
- Joined: 17 Jul 2009
- Has thanked: 5 times
- Been thanked: 10 times
% Percentage Chart (indicator)
- Attachments
-
- Cours%DateRef_Multi01By.TXT
- (2.54 KiB) Downloaded 668 times
-
arnie

- Posts: 1594
- Joined: 11 Feb 2009
- Location: Portugal
- Has thanked: 481 times
- Been thanked: 514 times
Re: MULTICHARTS 9.0 RELEASE
This is awesome!Hello Arnie, about your request for % charts, here is an indicator script.
Hope it helps.
Sorry, some comments are in french, and 2 subsidiary functions need to be commented out (or rewritten using my comments__ in english) They are used only to draw arrow or small texts on charts.
Many, many thanks Yves.
Re: MULTICHARTS 9.0 RELEASE
Hello Arnie, about your request for % charts, here is an indicator script.
Hope it helps.
Sorry, some comments are in french, and 2 subsidiary functions need to be commented out (or rewritten using my comments__ in english) They are used only to draw arrow or small texts on charts.
Hello Yves
Your indicator looks very interesting, so I tried to apply it to a 4 dataset 10 min FX chart.
I edited out the 2 EcritGraph functions and input the date 150218 however I get a zero plot
My apologies for not better interpreting your indicator. My programming skills are very limited. Would it be possible to say what I have done wrong.
-
Yves BENOIT
- Posts: 30
- Joined: 17 Jul 2009
- Has thanked: 5 times
- Been thanked: 10 times
Re: MULTICHARTS 9.0 RELEASE
Draw your 4 instruments in subcharts, to check if you have no difficulty in data.
Check if Sessions and Exchange time are the same.
Check if you have data on Feb.18 2015 and after, but also on the bar preceding this date, since I check on Date[1].
Uncomment the 2 'Print' to see at what stage it's locked.
Check if Sessions and Exchange time are the same.
Check if you have data on Feb.18 2015 and after, but also on the bar preceding this date, since I check on Date[1].
Uncomment the 2 'Print' to see at what stage it's locked.
-
arnie
- Posts: 1594
- Joined: 11 Feb 2009
- Location: Portugal
- Has thanked: 481 times
- Been thanked: 514 times
Re: MULTICHARTS 9.0 RELEASE
It's working beautifully here.Hello Yves
Your indicator looks very interesting, so I tried to apply it to a 4 dataset 10 min FX chart.
I edited out the 2 EcritGraph functions and input the date 150218 however I get a zero plot
My apologies for not better interpreting your indicator. My programming skills are very limited. Would it be possible to say what I have done wrong.
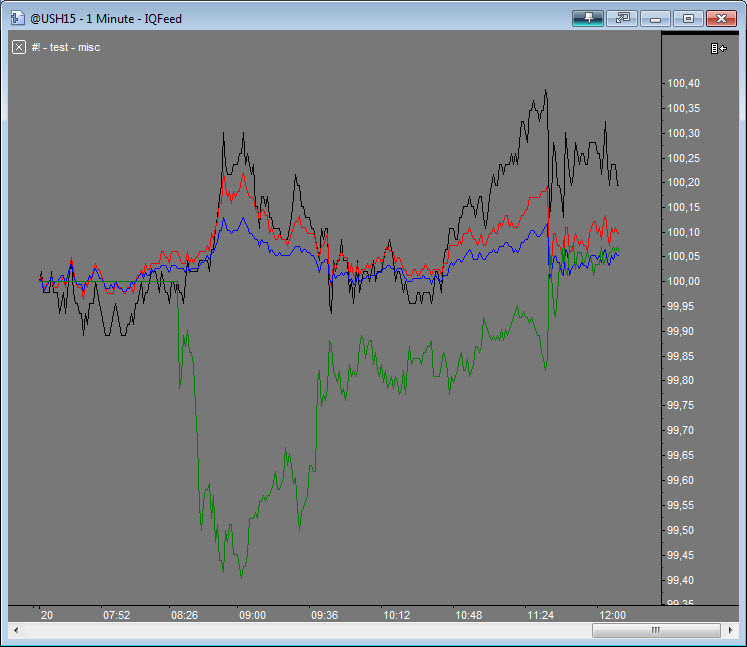
ES, ZN, ZB and ZF
I loaded 3 days and I'm plotting 1min data.
All with the same time zone.
- Attachments
-
- comp_sym.jpg
- (121.76 KiB) Downloaded 3311 times
-
arnie
- Posts: 1594
- Joined: 11 Feb 2009
- Location: Portugal
- Has thanked: 481 times
- Been thanked: 514 times
Re: % Percentage Chart (indicator)
Although the study does exactly what is expected of it, a MC limitation handicaps the use of it 
The problem is exactly the same I had with the quoteboards a couple of years ago.
If we start mixing data with different end times the study stops updating as soon the first data end time is hit.
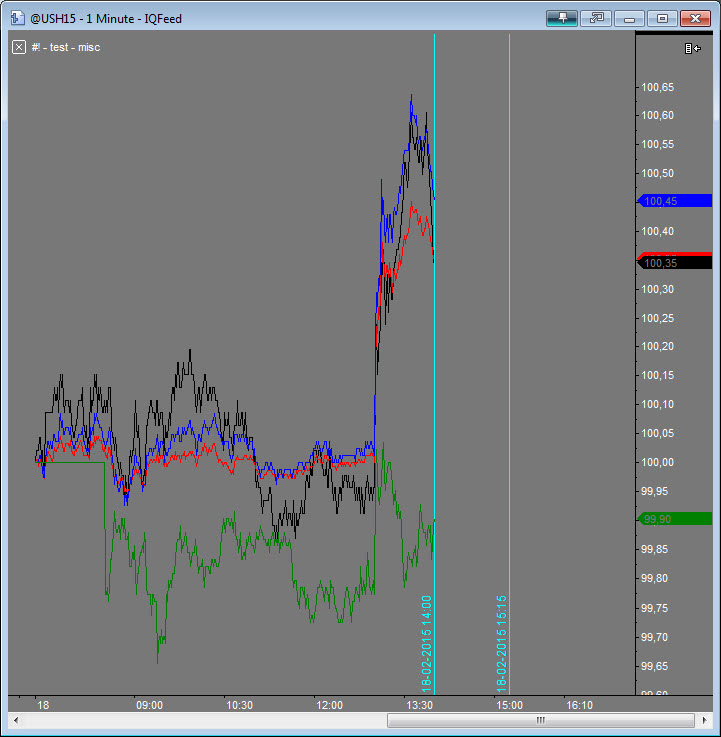
Here's an example, treasuries and equities.
The first ends its pit session at 14:00 CT while the second ends at 15:15 CT.
As you can see, the study stopped updating when treasuries pit session closed while ES continue to trade for another hour and 15 min.
The problem is exactly the same I had with the quoteboards a couple of years ago.
If we start mixing data with different end times the study stops updating as soon the first data end time is hit.
Here's an example, treasuries and equities.
The first ends its pit session at 14:00 CT while the second ends at 15:15 CT.
As you can see, the study stopped updating when treasuries pit session closed while ES continue to trade for another hour and 15 min.
- Attachments
-
- stop.jpg
- (108.41 KiB) Downloaded 3281 times
-
TJ

- Posts: 7744
- Joined: 29 Aug 2006
- Location: Global Citizen
- Has thanked: 1033 times
- Been thanked: 2223 times
Re: % Percentage Chart (indicator)
What do you expect?Although the study does exactly what is expected of it, a MC limitation handicaps the use of it
The problem is exactly the same I had with the quoteboards a couple of years ago.
If we start mixing data with different end times the study stops updating as soon the first data end time is hit.
Here's an example, treasuries and equities.
The first ends its pit session at 14:00 CT while the second ends at 15:15 CT.
As you can see, the study stopped updating when treasuries pit session closed while ES continue to trade for another hour and 15 min.
This is a % chart. What do you think should happen next?
Hint: you can have anything you want... all you have to do is to articulate your need (instead of whining about it).
-
TJ
- Posts: 7744
- Joined: 29 Aug 2006
- Location: Global Citizen
- Has thanked: 1033 times
- Been thanked: 2223 times
Re: % Percentage Chart (indicator)
Maybe "Whining" is a strong word. I mean you have complained about it, but have not described (or suggested) how the line should be calculated beyond the session end.Really?(instead of whining about it).
-
arnie
- Posts: 1594
- Joined: 11 Feb 2009
- Location: Portugal
- Has thanked: 481 times
- Been thanked: 514 times
Re: % Percentage Chart (indicator)
Is not a question of calculation beyond session end. If the session has ended... there's nothing to be calculated right?Maybe "Whining" is a strong word. I mean you have complained about it, but have not described (or suggested) how the line should be calculated beyond the session end.Really?(instead of whining about it).
It's a question of when you have in a chart 2 or more data series with different session periods the study is always "attached" to the first series, even if you are "calling" data from the other ones. So if the first one ends first, even though the others continue to be opened, the study stops calculating.
As far as I know, this is a technical thing, it's how MC works, so one can't do much about it, hence the limitation I referred too.
Like I said, the study is working perfectly, one just need to use it with series that has the same session.
-
Henry MultiСharts

- Posts: 9165
- Joined: 25 Aug 2011
- Has thanked: 1264 times
- Been thanked: 2957 times
-
arnie
- Posts: 1594
- Joined: 11 Feb 2009
- Location: Portugal
- Has thanked: 481 times
- Been thanked: 514 times
Re: % Percentage Chart (indicator)
Thanks Henry.
That does allow the study to continue to calculate, though we lose the history of the move (hence its name).
-
sptrader
- Posts: 742
- Joined: 09 Apr 2010
- Location: Texas
- Has thanked: 483 times
- Been thanked: 274 times
- Contact:
Re: % Percentage Chart (indicator)
Could someone please post the "corrected" working code with the functions removed (text format is fine), I guess I'm the only one that can't get it to work...I tried to edit out the functions without luck...
I'm not a programmer and I just get a blank screen when applying "my version" of the study.
I have 4 instruments loaded, using "hidden" display mode, then apply the study and the screen is blank...
Should the "DateRef" input value be the current date or ????
Thanks in advance ... Steve
I'm not a programmer and I just get a blank screen when applying "my version" of the study.
I have 4 instruments loaded, using "hidden" display mode, then apply the study and the screen is blank...
Should the "DateRef" input value be the current date or ????
Thanks in advance ... Steve
-
arnie
- Posts: 1594
- Joined: 11 Feb 2009
- Location: Portugal
- Has thanked: 481 times
- Been thanked: 514 times
Re: % Percentage Chart (indicator)
I haven't had the time yet to try to fix the labels though this being arrays I might be in trouble in doing that.
It will be probably better just to code something from scratch (without the arrays) based on what I'm familiarized with so I can control the number of series I want to view through inputs.
The way the code is, with the labels commented, it plots fine.
For DateRef input, for today Feb 20, you should write 150220.
Kudos for Yves to share this with the community.
Code: Select all
Vars:IndicNom( "Cours%DateRef_Multi01By");

// 140330 V01

// 1502180159 some comments

// Yves BENOIT y.benoit@yahoo.fr


inputs: DateRef( 100101) ;


// DEFINITION DES VARIABLES & TABLEAUX

Vars: Init(0),Coef1(0),Date0(0),mm(0),M(4);

Arrays: TxStr[4](""),Coef[4](0),Couleur[4](Black);;


// INITIALISATIONS DES VALEURS

if Init=0 Then Begin

	Date0=1000000+DateRef;

	Couleur[1]=Black; //

	Couleur[2]=Red; //

	Couleur[3]=Blue; //

	Couleur[4]=DarkGreen; //

 	Init=1;

End; // Fin // Fin if Init=0


// COMMENCER A PARTIR DE DATEREF

if Date>=Date0 Then Begin


	// INITIALISATION AU MOMENT DE DATEREF ET TRACE FLECHE

	If Date[1]<Date0 Then Begin


		for mm=1 to M  Begin

			Coef[mm]=100/Close of Data(mm) ;

			TxStr[mm]=Symbol of Data(mm) ;

		End; // Fin mm=1 to M Then Begin


		// EcritGraphFlechText_DT01fBy is a function using all Arrow Drawing functions // Julian2YMD_d_hm_Str03fBy a function formatting DateTime in a conduced form// please do it yourself

		//EcritGraphFlechText_DT01fBy( DateTime,100,True,Black,8,13,Julian2YMD_d_hm_Str03fBy("",DateTime),

		//0,True,White,Black,"Courrier New",8 );

		// 				...True=Down, False=Up,Arrowsize, Type:0 a 13

		// 0=border 1=bold 2=Italic 3=strikeout 4=underline, True=on False=Off,...

		// Print(IndicNom+DateTimeToString(DateTime));


	End; // Fin If Date[1]<Date0


	// CALCULS ET TRACES DES GRAPHIQUES

	// Fake loop, because I can't use plot(mm). // At least, I could repeat Copy/Paste of first "plot1" more quickly and then replaced mm where necessary

	mm=1;

	Plot1( Close of Data(mm)* Coef[mm], "Pct1",Couleur[mm] ) ;

	mm=2;

	Plot2( Close of Data(mm)* Coef[mm], "Pct2",Couleur[mm] ) ;

	mm=3;

	Plot3( Close of Data(mm)* Coef[mm], "Pct3",Couleur[mm] ) ;

	mm=4;

	Plot4( Close of Data(mm)* Coef[mm], "Pct4",Couleur[mm] ) ;


End; // Fin if Date>=Date0


// ECRITURE FINALE DES NOMS DES INSTRUMENTS

//vars: Final(0);

//If Date=LastCalcDate and Time=LastCalcTime  Then Begin


	//for mm=1 to M  Begin

		// EcritGraphLgnText_DT01fBy is a function using all Text Manipulation functions // please do it yourself !

 		///EcritGraphLgnText_DT01fBy(DateTime,High of Data(mm)*Coef[mm],TxStr[mm],Couleur[mm],1,0,1,True,10,"Courrier New",White,True );

 		// 0=droite 1=gauche 2=centre, 0= Haut 1= Bas 2=centre, 0=border 1=bold 2=Italic 3=strikeout 4=underline, True=with border, FontSize


 		//Print(IndicNom+"> Final>"+NumtoStr(Date,0)+": "+TxStr[mm]);

	//end; // Fin for mm=1 to M


	//Final=1;

//End; // Fin If LastBarOnChart


// FIN Vars:IndicNom( "Cours%DateRef_Multi01By");
- Attachments
-
- comp_sym02.jpg
- (102.91 KiB) Downloaded 3219 times
-
sptrader
- Posts: 742
- Joined: 09 Apr 2010
- Location: Texas
- Has thanked: 483 times
- Been thanked: 274 times
- Contact:
Re: % Percentage Chart (indicator)
Thanks Arnie for taking the time to help and Kudos to Yves for sharing !!! Works great...
-
arnie
- Posts: 1594
- Joined: 11 Feb 2009
- Location: Portugal
- Has thanked: 481 times
- Been thanked: 514 times
Re: % Percentage Chart (indicator)
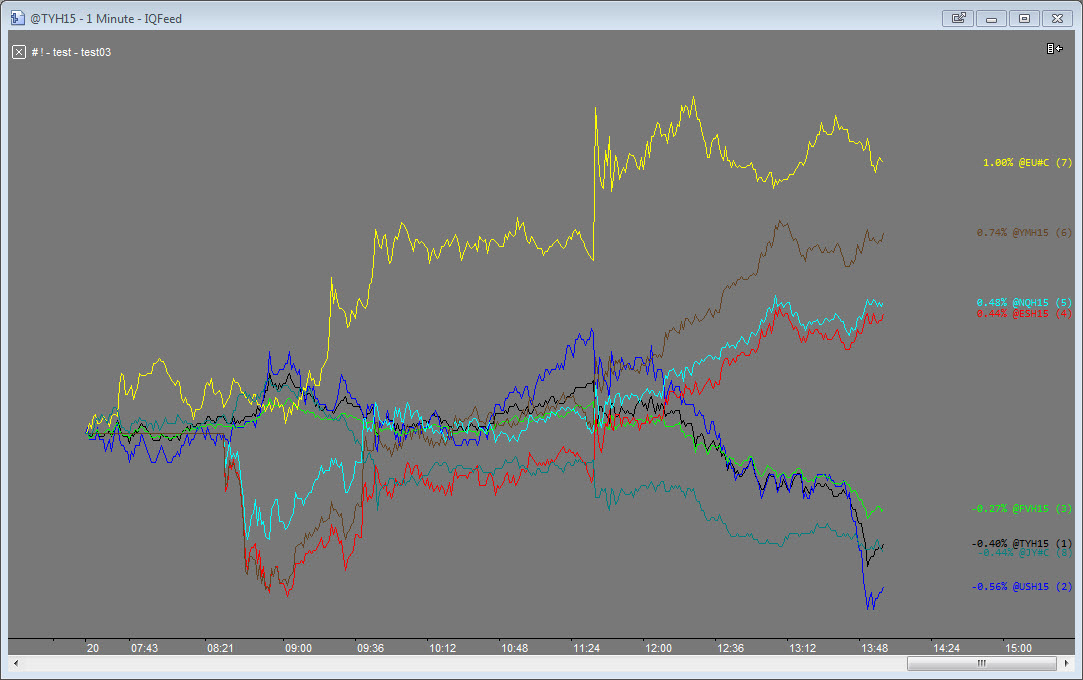
So today I spent the entire afternoon trying to make this more user friendly for me.
I ended up setting the study to support 8 data series.
We can set the color for each series through inputs. Also we need to select how many series are we using and if only 4 are used we need to switch to False the respective Series# input.
Labels are available and I decided to add the % so one can have a better reading of the move. Also, labels are plotted on the far right of the chart. I decided to remove the price scale from the chart for simplicity.
I removed the date input because I have no use for it. My interest is purely for the day. I add an input to only show today's session and remove the history. This input only works for RTH session templates.
This study was not yet tested during live markets so I cannot promise that this will work flawlessly.
I tested it by playback the chart and all seemed OK though playback more then 5 symbols the study did not reset properly but I have no idea if it's due to the playback.
Monday we give it a try.
Please feel free to improve it.
Code: Select all
// 140330 V01

// 1502180159 some comments

// Yves BENOIT y.benoit@yahoo.fr


// 150221 V02

// http://www.multicharts.com/discussion/viewtopic.php?f=1&t=48218


inputs:

	dataSeries		(4),

	ShowHistory		(false),

	ShowLabels		(true),

	LabelFont		("consolas"),

	LabelSize		(8),

	Series1		(true),

	Color1			(black),

	Series2		(true),

	Color2			(blue),

	Series3		(true),

	Color3			(green),

	Series4		(true),

	Color4			(red),

	Series5		(false),

	Color5			(cyan),

	Series6		(false),

	Color6			(darkbrown),

	Series7		(false),

	Color7			(yellow),

	Series8		(false),

	Color8			(darkcyan);


variables:

	todaySession		(0),

	newDay			(false),

	ii			(0),

	pctchg1		(0),

	pctchg2		(0),

	pctchg3		(0),

	pctchg4		(0),

	pctchg5		(0),

	pctchg6		(0),

	pctchg7		(0),

	pctchg8		(0),

	series1Txt		(-1),

	series2Txt		(-1),

	series3Txt		(-1),

	series4Txt		(-1),

	series5Txt		(-1),

	series6Txt		(-1),

	series7Txt		(-1),

	series8Txt		(-1);


arrays:

	Coef[]			(0),

	TxtStr[]		(""),

	PrevCl[]		(0);


once begin

	Array_SetMaxIndex(Coef, dataSeries);

	Array_SetMaxIndex(TxtStr, dataSeries);

	Array_SetMaxIndex(PrevCl, dataSeries);


	if ShowLabels = true then begin

		series1Txt = text_new_self_s(date, time_s, 0, "");

			text_setstyle(series1Txt, 1, 2);

			text_setsize(series1Txt, labelsize);

			text_setfontname(series1Txt, LabelFont);

			text_setcolor(series1Txt, color1);

			text_lock(series1Txt, true);

		series2Txt = text_new_self_s(date, time_s, 0, "");

			text_setstyle(series2Txt, 1, 2);

			text_setsize(series2Txt, labelsize);

			text_setfontname(series2Txt, LabelFont);

			text_setcolor(series2Txt, color2);

			text_lock(series2Txt, true);

		series3Txt = text_new_self_s(date, time_s, 0, "");

			text_setstyle(series3Txt, 1, 2);

			text_setsize(series3Txt, labelsize);

			text_setfontname(series3Txt, LabelFont);

			text_setcolor(series3Txt, color3);

			text_lock(series3Txt, true);

		series4Txt = text_new_self_s(date, time_s, 0, "");

			text_setstyle(series4Txt, 1, 2);

			text_setsize(series4Txt, labelsize);

			text_setfontname(series4Txt, LabelFont);

			text_setcolor(series4Txt, color4);

			text_lock(series4Txt, true);

		series5Txt = text_new_self_s(date, time_s, 0, "");

			text_setstyle(series5Txt, 1, 2);

			text_setsize(series5Txt, labelsize);

			text_setfontname(series5Txt, LabelFont);

			text_setcolor(series5Txt, color5);

			text_lock(series5Txt, true);

		series6Txt = text_new_self_s(date, time_s, 0, "");

			text_setstyle(series6Txt, 1, 2);

			text_setsize(series6Txt, labelsize);

			text_setfontname(series6Txt, LabelFont);

			text_setcolor(series6Txt, color6);

			text_lock(series6Txt, true);

		series7Txt = text_new_self_s(date, time_s, 0, "");

			text_setstyle(series7Txt, 1, 2);

			text_setsize(series7Txt, labelsize);

			text_setfontname(series7Txt, LabelFont);

			text_setcolor(series7Txt, color7);

			text_lock(series7Txt, true);

		series8Txt = text_new_self_s(date, time_s, 0, "");

			text_setstyle(series8Txt, 1, 2);

			text_setsize(series8Txt, labelsize);

			text_setfontname(series8Txt, LabelFont);

			text_setcolor(series8Txt, color8);

			text_lock(series8Txt, true);

	end;

end;


todaySession = CurrentSession(0);


if todaySession <> todaySession[1] then begin

	newDay = true;


	for ii  = 1 to dataSeries begin

		Coef[ii] = 100 / close of data(ii);

		TxtStr[ii] = Symbol of data(ii);

		PrevCl[ii] = close of data(ii);

	end;

end;


if newDay then begin

	if Series1 = true then begin

		ii = 1;

		pctchg1 = ((close of data(ii) / PrevCl[ii]) - 1) * 100;

		text_setstring(series1Txt, numtostr(pctchg1, 2) + "%" + " " + txtstr[ii] + " " + "(1)");


		if ShowHistory = true or (ShowHistory = false and (LastCalcDate = date)) then begin

			Plot1(close of Data(ii) * Coef[ii], "Pct1", color1);

			if barstatus(ii) = 2 then

				text_setlocation_s(series1Txt, JulianToDate(GetAppInfo(airightDispDateTime)),DateTime2ELTime_s(GetAppInfo(airightDispDateTime)),

					close of data(ii) * coef[ii]);

		end;

	end;

	if Series2 = true then begin

		ii = 2;

		pctchg2 = ((close of data(ii) / PrevCl[ii]) - 1) * 100;

		text_setstring(series2Txt,  numtostr(pctchg2, 2) + "%" + " " + txtstr[ii] + " " + "(2)");


		if ShowHistory = true or (ShowHistory = false and (LastCalcDate = date)) then begin

			Plot2(close of Data(ii) * Coef[ii], "Pct2", color2);

			if barstatus(ii) = 2 then

				text_setlocation_s(series2Txt, JulianToDate(GetAppInfo(airightDispDateTime)),DateTime2ELTime_s(GetAppInfo(airightDispDateTime)),

					close of data(ii) * coef[ii]);

		end;

	end;

	if Series3 = true then begin

		ii = 3;

		pctchg3 = ((close of data(ii) / PrevCl[ii]) - 1) * 100;

		text_setstring(series3Txt,  numtostr(pctchg3, 2) + "%" + " " + txtstr[ii] + " " + "(3)");


		if ShowHistory = true or (ShowHistory = false and (LastCalcDate = date)) then begin

			Plot3(close of Data(ii) * Coef[ii], "Pct3", color3);

			if barstatus(ii) = 2 then

				text_setlocation_s(series3Txt, JulianToDate(GetAppInfo(airightDispDateTime)),DateTime2ELTime_s(GetAppInfo(airightDispDateTime)),

					close of data(ii) * coef[ii]);

		end;

	end;

	if Series4 = true then begin

		ii = 4;

		pctchg4 = ((close of data(ii) / PrevCl[ii]) - 1) * 100;

		text_setstring(series4Txt,  numtostr(pctchg4, 2) + "%" + " " + txtstr[ii] + " " + "(4)");


		if ShowHistory = true or (ShowHistory = false and (LastCalcDate = date)) then begin

			Plot4(close of Data(ii) * Coef[ii], "Pct4", color4);

			if barstatus(ii) = 2 then

				text_setlocation_s(series4Txt, JulianToDate(GetAppInfo(airightDispDateTime)),DateTime2ELTime_s(GetAppInfo(airightDispDateTime)),

					close of data(ii) * coef[ii]);

		end;

	end;

	if Series5 = true then begin

		ii = 5;

		pctchg5 = ((close of data(ii) / PrevCl[ii]) - 1) * 100;

		text_setstring(series5Txt,  numtostr(pctchg5, 2) + "%" + " " + txtstr[ii] + " " + "(5)");


		if ShowHistory = true or (ShowHistory = false and (LastCalcDate = date)) then begin

			Plot5(close of Data(ii) * Coef[ii], "Pct1", color5);

			if barstatus(ii) = 2 then

				text_setlocation_s(series5Txt, JulianToDate(GetAppInfo(airightDispDateTime)),DateTime2ELTime_s(GetAppInfo(airightDispDateTime)),

					close of data(ii) * coef[ii]);

		end;

	end;

	if Series6 = true then begin

		ii = 6;

		pctchg6 = ((close of data(ii) / PrevCl[ii]) - 1) * 100;

		text_setstring(series6Txt,  numtostr(pctchg6, 2) + "%" + " " + txtstr[ii] + " " + "(6)");


		if ShowHistory = true or (ShowHistory = false and (LastCalcDate = date)) then begin

			Plot6(close of Data(ii) * Coef[ii], "Pct2", color6);

			if barstatus(ii) = 2 then

				text_setlocation_s(series6Txt, JulianToDate(GetAppInfo(airightDispDateTime)),DateTime2ELTime_s(GetAppInfo(airightDispDateTime)),

					close of data(ii) * coef[ii]);

		end;

	end;

	if Series7 = true then begin

		ii = 7;

		pctchg7 = ((close of data(ii) / PrevCl[ii]) - 1) * 100;

		text_setstring(series7Txt,  numtostr(pctchg7, 2) + "%" + " " + txtstr[ii] + " " + "(7)");


		if ShowHistory = true or (ShowHistory = false and (LastCalcDate = date)) then begin

			Plot7(close of Data(ii) * Coef[ii], "Pct3", color7);

			if barstatus(ii) = 2 then

				text_setlocation_s(series7Txt, JulianToDate(GetAppInfo(airightDispDateTime)),DateTime2ELTime_s(GetAppInfo(airightDispDateTime)),

					close of data(ii) * coef[ii]);

		end;

	end;

	if Series8 = true then begin

		ii = 8;

		pctchg8 = ((close of data(ii) / PrevCl[ii]) - 1) * 100;

		text_setstring(series8Txt,  numtostr(pctchg8, 2) + "%" + " " + txtstr[ii] + " " + "(8)");


		if ShowHistory = true or (ShowHistory = false and (LastCalcDate = date)) then begin

			Plot8(close of Data(ii) * Coef[ii], "Pct4", color8);

			if barstatus(ii) = 2 then

				text_setlocation_s(series8Txt, JulianToDate(GetAppInfo(airightDispDateTime)),DateTime2ELTime_s(GetAppInfo(airightDispDateTime)),

					close of data(ii) * coef[ii]);

		end;

	end;

end;
- Attachments
-
- comp_sym03.jpg
- (158.26 KiB) Downloaded 3205 times