I am trying to find the code to set colour between two plots (that is the background fill colour between these two plots). For example between two moving averages.
I thought I needed some kind of "fill" function but that doesn't seem to exist in Easylanguage?
Setting a color fill between plots [SOLVED]
-
TJ

- Posts: 7744
- Joined: 29 Aug 2006
- Location: Global Citizen
- Has thanked: 1033 times
- Been thanked: 2223 times
Re: Setting a color fill between plots
Please give an example with a mock up drawing.I am trying to find the code to set colour between two plots (that is the background fill colour between these two plots). For example between two moving averages.
I thought I needed some kind of "fill" function but that doesn't seem to exist in Easylanguage?
Thanks TJ
see attached example of a chart with 3 MA's. I would like to create a color fill between the MA's. So I would then have "bands" of colour between the plots of the Ma's.
- Attachments
-
- movavg3linecross.png
- (76.08 KiB) Downloaded 1623 times
-
TJ
- Posts: 7744
- Joined: 29 Aug 2006
- Location: Global Citizen
- Has thanked: 1033 times
- Been thanked: 2223 times
Re: Setting a color fill between plots
You must have the 3 MAs in the same indicator.Please give an example with a mock up drawing.I am trying to find the code to set colour between two plots (that is the background fill colour between these two plots). For example between two moving averages.
I thought I needed some kind of "fill" function but that doesn't seem to exist in Easylanguage?
Thanks TJ
see attached example of a chart with 3 MA's. I would like to create a color fill between the MA's. So I would then have "bands" of colour between the plots of the Ma's.
Set the plot style of one MA as "Bar High",
and set the other MA as "Bar Low".
Set the thickness as wide as possible.
Re: Setting a color fill between plots
Again thanks TJ
I cant get connected to CQG right now so can't test for couple days. I will advise ,once I test. It was good of you to respond so quickly much appreciated.
Hi TJ
I have now tested your recommended parameter settings. Unfortunately it is not what I am seeking and it seems too limited. I have attached an example of what it looks like using your settings suggestion so you can see why I need to probably find and easylanguage script that I can included in my indicator.
Thanks TJ
- Attachments
-
- tj_colourbands.png
- (81.5 KiB) Downloaded 1628 times
How to add a script to Indicator to create colour fill bands
I am wanting to have a script that I can add to my Volume Indicator that can fill a defined color between moving average lines. I know I can use the "Bar Hi" and Bar Low" style menu in Multicharts but this is a very limited function and doesn't allow for multiple colour "bands" and it only fills with individual color "bars" and not a proper "fill color" (like a normal background color).
See attached chart to demonstrate what I am trying to achieve.
Appreciate any guidance on this.
See attached chart to demonstrate what I am trying to achieve.
Appreciate any guidance on this.
- Attachments
-
- colourbands.png
- (85.22 KiB) Downloaded 1615 times
-
arnie

- Posts: 1594
- Joined: 11 Feb 2009
- Location: Portugal
- Has thanked: 481 times
- Been thanked: 514 times
Re: How to add a script to Indicator to create colour fill b [SOLVED]
MC does not have transparency options nor fill options.I am wanting to have a script that I can add to my Volume Indicator that can fill a defined color between moving average lines. I know I can use the "Bar Hi" and Bar Low" style menu in Multicharts but this is a very limited function and doesn't allow for multiple colour "bands" and it only fills with individual color "bars" and not a proper "fill color" (like a normal background color).
See attached chart to demonstrate what I am trying to achieve.
Appreciate any guidance on this.
The only way we have to mimic that is in fact "playing" with the bar high/low and its thickness. Obvious it's not perfect but with some imagination one can have satisfactory results.
By your image I don't believe you have selected the thickness line available.
Also, it's possible for you to select the thickness you want using the existing keyword in the script.
"Playing" with the thickness of the lines, plot order and number of plots you would be amazed what you can do.
But again, it's far from what we all want, transparency and fill options.
Re: Setting a color fill between plots
Hi Arnie
Yes I guess you are correct so I created multiple codes of each Moving Average then played around with the Bar High/Bar Low settings and Histogram settings etc. I got what I wanted... Not an elegant way but it works. Then I had to find a way of positioning the color bands behind the Volume Histogram. Since I cant find a way of coding "visual order" of Moving Averages etc within the Indicator code I "cheated" and duplicated the indicator and displayed one Indicator over another then made some elements "invisible".. again not elegant but it works.
So unless you know some code that allows me to use "visual order" in my Indicator I may have to accept this "cluncky" solution.
Thanks Arnie
-
arnie
- Posts: 1594
- Joined: 11 Feb 2009
- Location: Portugal
- Has thanked: 481 times
- Been thanked: 514 times
Re: Setting a color fill between plots
This was what I did with my VWAP bands. By playing with the plot order we can put lines in front of each other creating this way the illusion of a transparency.
You need to have 2 lines, one for you to set for the high and low and the other you set as a standard line.
In your case, with the volume histogram, instead of using the default MC study, code the volume histogram inside of your study which will facilitate your plot order and this way you can more easily manage which one you want to put in front.
- Attachments
-
- vwap_bands.jpg
- (72 KiB) Downloaded 1614 times
Re: Setting a color fill between plots
Hi Arnie
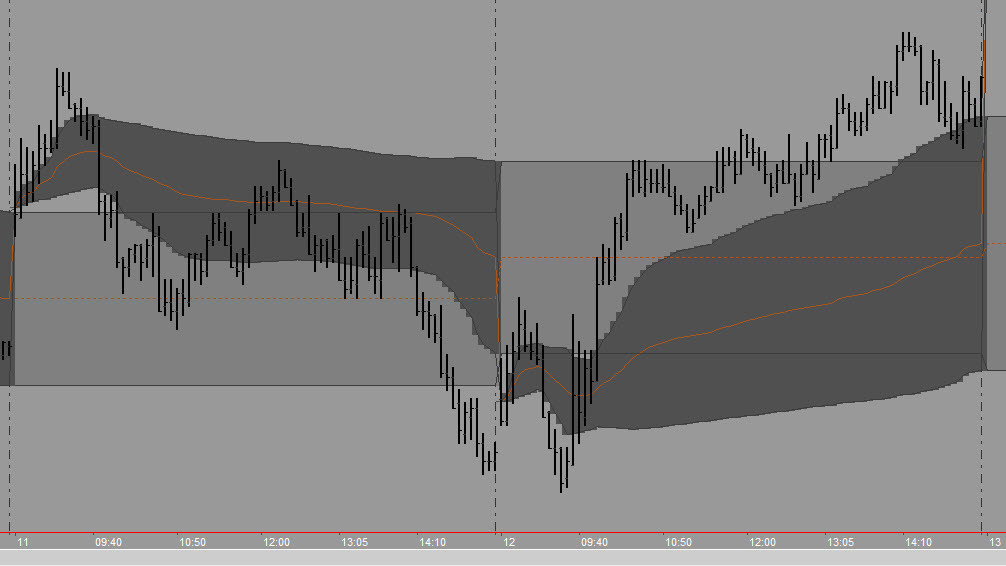
Your explanation was great and I was able to understand now more about how this all works. I was looking for an EasyLanguage coding solution to do it all, and obviously there isn't one (yet)... your explanation made me realise I needed to understand how Multicharts was using easylanguage and try to code my Indicator accordingly then to basically "manipulate" the MC settings to get the desired result.
So I modified my Indiator code then played around as you suggested with those MC settings etc and was able to get all my Volume Indicator settings to work including the Visual Order needs... thanks to you.
See attached result
Thanks again Arnie
- Attachments
-
- VolIndicatorColorBands.png
- (61.3 KiB) Downloaded 1618 times