
MultiCharts 8.5 Release Candidate is final version before our major upgrade that features all-new Volume Delta and Cumulative Delta chart types, Volume Profile built from the ground up, TimePriceOpportunity built-in indicator, all-new partner offer from DTN IQFeed for free 30 days of real-time futures, index and FX data, new data feed and broker connections from AvaTrade (formerly AvaFX) and WeBank, and increased overall stability and performance. New flexible commission rules allow setting virtually any commission structure for accurate backtesting. Order and Position tracker has two new tabs – “Alerts” and “Market Position History at Broker”.
Read more...
How to Migrate from MultiCharts 32 bit to MultiCharts 64 bit
https://www.multicharts.com/trading-software/index.
MULTICHARTS 8.5 RELEASE CANDIDATE
-
Dave Masalov

- Posts: 1712
- Joined: Apr 16 2010
- Has thanked: 51 times
- Been thanked: 490 times
Hello arnie,Is it me or despite having the countdown checked on the Format Window there's no countdown on the charts?
Please make sure that you get real-time data on your chart, your local time and time zone settings (including daylight saving settings) are correct and resolution of your chart is no more than 1 hour.
If the problem persists, please come to our Live Chat Mon-Fri from 6:30 AM to 4 PM EST so we can help you: http://messenger.providesupport.com/mes ... pport.html
-
arnie

- Posts: 1594
- Joined: Feb 11 2009
- Location: Portugal
- Has thanked: 481 times
- Been thanked: 514 times
Please make sure that you get real-time data on your chart, your local time and time zone settings (including daylight saving settings) are correct and resolution of your chart is no more than 1 hour.
I figured out the problem.
The marker of one of the indicators was covering the counter, although it's a bit strange because being the indicator marker the last price and being the counter below it, why is it covered?
Thanks.
- Attachments
-
- countdown_covered.png
- (36.58 KiB) Downloaded 6196 times
-
Dave Masalov
- Posts: 1712
- Joined: Apr 16 2010
- Has thanked: 51 times
- Been thanked: 490 times
arnie,I figured out the problem.
The marker of one of the indicators was covering the counter, although it's a bit strange because being the indicator marker the last price and being the counter below it, why is it covered?
This is normal behavior. Price marker and counter are one and the same object. You can bring price marker to front by right-clicking on the chart and clicking Visual Order.

-
Dave Masalov
- Posts: 1712
- Joined: Apr 16 2010
- Has thanked: 51 times
- Been thanked: 490 times
Hello MC_Prog,Hi.
I am observing that the optimization report is not remaining with a chart window when the chart is copied. (MC 8.5rc 64b Build 6662)
Please check the Store Optimization Report in File -> Preferences -> Workspaces -> Saving Data.
Very good. That solves that. Thanks!Please check the Store Optimization Report in File -> Preferences -> Workspaces -> Saving Data.
I have another observation.
In the Exhaustive Search Properties dialog it seems that when a box is UNchecked (meaning do not optimize this param, and ignore the range settings without perturbing them) the opt runs not with the Current Value (as it should), but with the Start Value of that param.
Then, after the opt, if you go to apply one of the opt results, the Current Value is back in effect, meaning that you cannot get the result that you see from the opt table instantiated on the chart.
Correct behavior would be:
When a param box is unchecked, use the Current Value during the opt
When a param box is checked, use the Start Value, End Value, and Step Value during the opt
In all cases, when applying an opt report result, the chart should take the params used in that iteration and thus agree with the opt report results.
If I am misunderstanding the current facts, please let me know. Thanks.
-
swz168

- Posts: 120
- Joined: Sep 30 2010
- Location: Germany
- Has thanked: 47 times
- Been thanked: 32 times
Decimal separator problem exists in Portfolio Backtester too.
Field: Potential Loss Per Contract. If input 0.001 it is saved as 1 when loading the saved portfolio backtester workspace.
Please check also whether the same problem exist with optimizer in portfolio backtester.
Field: Potential Loss Per Contract. If input 0.001 it is saved as 1 when loading the saved portfolio backtester workspace.
Please check also whether the same problem exist with optimizer in portfolio backtester.
-
Dave Masalov
- Posts: 1712
- Joined: Apr 16 2010
- Has thanked: 51 times
- Been thanked: 490 times
MC_Prog,Very good. That solves that. Thanks!Please check the Store Optimization Report in File -> Preferences -> Workspaces -> Saving Data.
I have another observation.
In the Exhaustive Search Properties dialog it seems that when a box is UNchecked (meaning do not optimize this param, and ignore the range settings without perturbing them) the opt runs not with the Current Value (as it should), but with the Start Value of that param.
Then, after the opt, if you go to apply one of the opt results, the Current Value is back in effect, meaning that you cannot get the result that you see from the opt table instantiated on the chart.
Correct behavior would be:
When a param box is unchecked, use the Current Value during the opt
When a param box is checked, use the Start Value, End Value, and Step Value during the opt
In all cases, when applying an opt report result, the chart should take the params used in that iteration and thus agree with the opt report results.
If I am misunderstanding the current facts, please let me know. Thanks.
Expected behavior is the following:
When an input box is unchecked, use the Start Value during the optimization. When you apply the optimization results, Current Value becomes equal to Start Value used during the optimization.
-
Dave Masalov
- Posts: 1712
- Joined: Apr 16 2010
- Has thanked: 51 times
- Been thanked: 490 times
swz168,Decimal separator problem exists in Portfolio Backtester too.
Field: Potential Loss Per Contract. If input 0.001 it is saved as 1 when loading the saved portfolio backtester workspace.
Please check also whether the same problem exist with optimizer in portfolio backtester.
We failed to reproduce the issue. Please come to our Live Chat Mon-Fri from 6:30 AM to 1 PM EST to demonstrate the issue: http://messenger.providesupport.com/mes ... pport.html
-
swz168
- Posts: 120
- Joined: Sep 30 2010
- Location: Germany
- Has thanked: 47 times
- Been thanked: 32 times
Have you tested it on a Windows with regional setting where decimal separator is a comma? It is basically the same problem I reported for MC8.5 Beta 2. The reported problem there has been fixed with RC version.We failed to reproduce the issue. Please come to our Live Chat Mon-Fri from 6:30 AM to 1 PM EST to demonstrate the issue: http://messenger.providesupport.com/mes ... pport.html
The whole problem on Windows with comma as decimal separator is that you don't have consistency:
Following is used as decimal separator:
Powerlanguage: Dot
Chart optimizer input: comma
Backtester input: comma
Format Signal dialog: dot
So one has to be careful what to enter and it is very confusing (one time you use dot the other time you use comma...). With RC, MC is intelligent enough to know what is entered, except the above problem in Backtester.
This makes it not possible to perform the proper guidance of sequential optimizations by using the checkboxes (which is the point of them in the first place).MC_Prog,Very good. That solves that. Thanks!Please check the Store Optimization Report in File -> Preferences -> Workspaces -> Saving Data.
I have another observation.
In the Exhaustive Search Properties dialog it seems that when a box is UNchecked (meaning do not optimize this param, and ignore the range settings without perturbing them) the opt runs not with the Current Value (as it should), but with the Start Value of that param.
Then, after the opt, if you go to apply one of the opt results, the Current Value is back in effect, meaning that you cannot get the result that you see from the opt table instantiated on the chart.
Correct behavior would be:
When a param box is unchecked, use the Current Value during the opt
When a param box is checked, use the Start Value, End Value, and Step Value during the opt
In all cases, when applying an opt report result, the chart should take the params used in that iteration and thus agree with the opt report results.
If I am misunderstanding the current facts, please let me know. Thanks.
Expected behavior is the following:
When an input box is unchecked, use the Start Value during the optimization. When you apply the optimization results, Current Value becomes equal to Start Value used during the optimization.
The as-is design requires the user to manually type the Current Value into the Start Value column after each step of the sequential optimization.
Correct behavior (design), as I wrote above, would keep good found values without requiring them to be retyped by the user. Instead, just uncheck them!
Please consider the use case:
1. Default values are set to "something thought maybe reasonable"
2. Inputs related to Entry are optimized (by checking them)
3. A good performance iteration is selected from the opt results. (choosing desired Entry Inputs)
4. Inputs related to Exit are now optimized (by checking them, with Entry Inputs unchecked)
5. A good performance iteration is selected from the opt results. (choosing desired Exit Inputs)
We now have what is typically a pretty darn good result, and it took (for example) 2000 iterations to arrive at rather than 1 million. (Aside: it is true we did not cover the whole search space, but that is exactly the point!!)
In my use case, no parameters had to be retyped at all, ever. In my use case, there is never a disagreement between where the user thinks they started (parameter-wise) and where he ends up. In my use case, no result is ever lost and every step of sequential optimization will yield better (or at very worst equal) results. In my use case, the chart will always agree with a selected optimization result.
With respect for the efforts expended so far, the currently expected behavior does need an upgrade!
We are going to be living with 8.5 in the field for a long time. For those of us doing alot of optimzation, it makes a huge difference whether or not the checkbox feature accomplishes the use case or not. Please consider retooling this one more time before going final.
-
Dave Masalov
- Posts: 1712
- Joined: Apr 16 2010
- Has thanked: 51 times
- Been thanked: 490 times
MC_Prog,
Thank you for your suggestion. This modification has been added to our to-do list.
Thank you for your suggestion. This modification has been added to our to-do list.

MC_Prog,
Thank you for your suggestion. This modification has been added to our to-do list.
What MC_Prog has suggested may seem like a small detail, but is actually quite a significant one when you're in the trenches performing repeated optimizations. MultiCharts has made amazing progress over the past several years, and it's detailed features like this one suggested by MC_PROG that keep it that way.
Thanks Dave for adding to the to-do list!!
-
swz168
- Posts: 120
- Joined: Sep 30 2010
- Location: Germany
- Has thanked: 47 times
- Been thanked: 32 times
In Strategy Performance Report -> Settings -> Display -> Regional Currency
If I set for the regional setting a conversion rate, it is applied to all charts with Strategy Performance report. this setting must be chart / instrument related.
Eg.:
Chart 1: the setting is for Currency is $ because all profits/loss are in $.
Chart 2: all profits/loss shown are in euro, but I want to convert it to dollar. So I set a conversion rate for Regional Currency. If I do so, the conversion rate is applied on chart 1 too, leading to wrong results on chart 1.
This behavior leads to an constant change of the setting. Each Chart should have and save its own individual Regional Currency.
-
Dave Masalov
- Posts: 1712
- Joined: Apr 16 2010
- Has thanked: 51 times
- Been thanked: 490 times
This will be implemented in one of the future versions. Current currency conversion feature will be replaced by a new one allowing you to set the currency for every instrument.In Strategy Performance Report -> Settings -> Display -> Regional Currency
If I set for the regional setting a conversion rate, it is applied to all charts with Strategy Performance report. this setting must be chart / instrument related.
Eg.:
Chart 1: the setting is for Currency is $ because all profits/loss are in $.
Chart 2: all profits/loss shown are in euro, but I want to convert it to dollar. So I set a conversion rate for Regional Currency. If I do so, the conversion rate is applied on chart 1 too, leading to wrong results on chart 1.
This behavior leads to an constant change of the setting. Each Chart should have and save its own individual Regional Currency.
Hi.
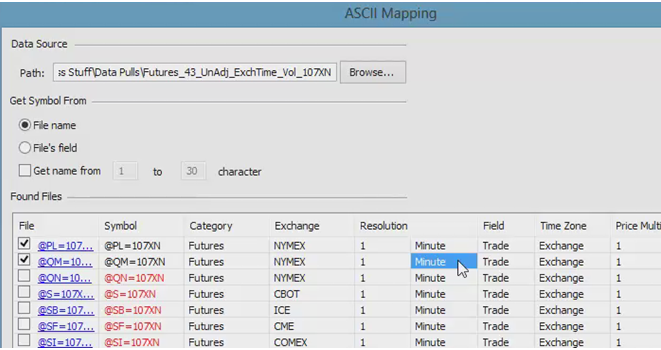
I'm not able to connect to data via ASCII mapping in MC 8.5 rc.
In the Quote Manager, I do the mapping and it is reported "N Symbols Mapped", all looks well.
Then when I go to open a chart, I see those symbols under the Data Source of ASCII Mapping, however after choosing any of them, the chart simply reports 'No Data' and there is no data to be seen.
Fix note: It turns out that by manually resetting my file resolutions to exactly what they were already my mappings are restored. Not sure why I had to do that, but glad I found it!
- Attachments
-
- 1m_ASCII_Map_Resetting.png
- Resetting Resolution to same as befopre
- (159.62 KiB) Downloaded 6103 times
Last edited by MC_Prog on Feb 07 2013, edited 3 times in total.
Hi,
I am just curious, Andrew made posts to the PM entries shown below suggesting that they would be brought out on MC 8.5 (beta 2 actually). So last night I went through the MC 8.5 release features to see if I could see mention of these and I found nothing. Did I miss it or have then been rescheduled for MC 9.0 or something?
Thanks,
John
MC-436 - TL_Persist, Text_Persist, Arw_Persist
https://www.multicharts.com/pm/viewissu ... _no=MC-436
https://www.multicharts.com/pm/viewissu ... _no=MC-423
I am just curious, Andrew made posts to the PM entries shown below suggesting that they would be brought out on MC 8.5 (beta 2 actually). So last night I went through the MC 8.5 release features to see if I could see mention of these and I found nothing. Did I miss it or have then been rescheduled for MC 9.0 or something?
Thanks,
John
MC-436 - TL_Persist, Text_Persist, Arw_Persist
https://www.multicharts.com/pm/viewissu ... _no=MC-436
MC-423 - More methods to execute a study.Untitled comment
Posted by Andrew MultiCharts (Andrew MultiCharts), Jan 28, 11:10
[RecoverDrawings = false] should help
Issue updated
Posted automatically on behalf of Andrew MultiCharts (Andrew MultiCharts), Jan 28, 11:09
This issue is targeted for MultiCharts 8.5 Beta 2 (RELEASED).
https://www.multicharts.com/pm/viewissu ... _no=MC-423
Issue progress updated
Posted automatically on behalf of Andrew MultiCharts (Andrew MultiCharts), Jan 18, 09:49
This issue's status has been changed to 'Implemented'.
Issue updated
Posted automatically on behalf of Andrew MultiCharts (Andrew MultiCharts), Jan 18, 09:48
This issue is targeted for MultiCharts 8.5 Beta 2 (RELEASED).
-
Andrew MultiCharts

- Posts: 1587
- Joined: Oct 11 2011
- Has thanked: 931 times
- Been thanked: 559 times
... Did I miss it or have then been rescheduled for MC 9.0 or something?
MC-436 - TL_Persist, Text_Persist, Arw_Persist
https://www.multicharts.com/pm/viewissu ... _no=MC-436

Did you try this? If it is not working, please elaborate.
1/ execute on every tick (every trade) - possible: IOG in real-time or IOG + 1 tick BM.MC-423 - More methods to execute a study.
https://www.multicharts.com/pm/viewissu ... _no=MC-423
2/ execute on every change in bid. - possible: use bid series
3/ execute on every change in ask. - possible: use ask series
4/ execute on every regular interval of X seconds (example .5 seconds). - possible: RecalcLastBarAfter
5/ execute on FKey? pressed. - not implemented.
Dear Multicharts,
Due to working with the Portfolio Backtester, I have combined different Variables which are indicating the openposition profit in a portfolio for every study. In this example I had two different Studys on the same currency. The table below shows the:
- openpositionprofit of first study,
- openpositionprofit of second study (obtained with GV),
- portfolio_openpositionprofit of whole portfolio
In my oppinion the portfolio_openposition should be the sum of openpositionprofit of each study ?
May you please expain me how this variables were computed.
Thanks a lot.
Code: Select all
PROFIT: 0.30000 -3.40000 -5.30000

PROFIT: 4.80000 -5.60000 -3.20000

PROFIT: 3.60000 -8.00000 -3.80000

PROFIT: 8.00000 -7.40000 -1.60000

PROFIT: 2.80000 -9.60000 -4.20000

PROFIT: 2.80000 -7.00000 -4.20000

PROFIT: 2.80000 -7.00000 -4.20000

PROFIT: 3.60000 -7.00000 -3.80000

PROFIT: -1.60000 -7.40000 -6.40000

PROFIT: -10.00000 -4.80000 -10.60000

PROFIT: -7.20000 -0.60000 -14.00000

PROFIT: -9.20000 -6.80000 -12.00000

PROFIT: -21.20000 -2.80000 0.00000

PROFIT: -21.60000 21.20000 0.40000

PROFIT: -26.00000 22.00000 4.80000

PROFIT: -20.00000 30.80000 -1.20000

PROFIT: -9.20000 18.80000 -12.00000

PROFIT: -8.00000 -2.80000 -13.20000

PROFIT: -7.20000 -5.20000 -14.00000

PROFIT: 0.00000 -6.80000 -21.20000

PROFIT: 6.80000 -21.20000 -18.40000
I have one problem with the master strategy and the breakeven stop with IB and real account.
I normally use the master strategy with the setting for the NQ as follows:
- PrTarget: 14 Ticks, SL: 9 Ticks, Stop Loss As: StopLimit, Offset 2
- At Broker Profiles i have unchecked "Use Native OCO Group".
Only with these settings both orders Target and Stopp are both sent to the Globex Exchange what i want and worked for month.
Now i wanted to add the Breakeven Option with Activate at Profit 7 Ticks, TrCost 1 Tick, Stop Limit Offset 2.
After hitting the Breakeven point the MC/TWS goes nuts, sending and cancelling over 10 orders per second so i need to use the close button to get out. It seems as "Use Native OCO Group" is unchecked the TWS does not know wich oder to modify.
These happens only with a real account, not with a demo.
-
Henry MultiСharts

- Posts: 9165
- Joined: Aug 25 2011
- Has thanked: 1264 times
- Been thanked: 2958 times
Hello bailey,Dear Multicharts,
Due to working with the Portfolio Backtester, I have combined different Variables which are indicating the openposition profit in a portfolio for every study. In this example I had two different Studys on the same currency. The table below shows the:
- openpositionprofit of first study,
- openpositionprofit of second study (obtained with GV),
- portfolio_openpositionprofit of whole portfolio
In my oppinion the portfolio_openposition should be the sum of openpositionprofit of each study ?
May you please expain me how this variables were computed.
Thanks a lot.
That is correct, Portfolio_OpenPositionProfit is the sum of OpenPositionProfit of each study.
Have you tried to print out the OpenPositionProfit of the second study without use of GV?
In our environment we have a correct calculation of Portfolio_OpenPositionProfit without using GV.
Please have a look at the attached screenshot.
- Attachments
-
- opp_opp_p.PNG
- (40.45 KiB) Downloaded 5047 times
-
Henry MultiСharts
- Posts: 9165
- Joined: Aug 25 2011
- Has thanked: 1264 times
- Been thanked: 2958 times
Hello SP,I have one problem with the master strategy and the breakeven stop with IB and real account.
I normally use the master strategy with the setting for the NQ as follows:
- PrTarget: 14 Ticks, SL: 9 Ticks, Stop Loss As: StopLimit, Offset 2
- At Broker Profiles i have unchecked "Use Native OCO Group".
Only with these settings both orders Target and Stopp are both sent to the Globex Exchange what i want and worked for month.
Now i wanted to add the Breakeven Option with Activate at Profit 7 Ticks, TrCost 1 Tick, Stop Limit Offset 2.
After hitting the Breakeven point the MC/TWS goes nuts, sending and cancelling over 10 orders per second so i need to use the close button to get out. It seems as "Use Native OCO Group" is unchecked the TWS does not know wich oder to modify.
These happens only with a real account, not with a demo.
We were unable to replicate the same behavior in our environment.
If you have not restarted MultiCharts after this behavior appeared please send me (support@multicharts.com) the logs for analysis. Here is how to do that.
In MultiCharts go to File->New->Open Order and position tracker window-> Orders tab->make sure you are not filtering the information in columns, then go to File->Export to excel.
Please highlight the problem orders in the Excel file and send it to me.
If you have already restarted MC then please import the attached AllTracesOn64.reg file while MC is closed to enable full logging. Once the problem is reproduced please send me the required files.
You can also come to our live chat Monday-Friday 6:30 am - 4 pm EST to demonstrate this behavior. One of the operators will collect all information required for analysis.
- Attachments
-
- AllTraces64bit.zip
- (1.11 KiB) Downloaded 625 times
Hello bailey,Dear Multicharts,
Due to working with the Portfolio Backtester, I have combined different Variables which are indicating the openposition profit in a portfolio for every study. In this example I had two different Studys on the same currency. The table below shows the:
- openpositionprofit of first study,
- openpositionprofit of second study (obtained with GV),
- portfolio_openpositionprofit of whole portfolio
In my oppinion the portfolio_openposition should be the sum of openpositionprofit of each study ?
May you please expain me how this variables were computed.
Thanks a lot.
That is correct, Portfolio_OpenPositionProfit is the sum of OpenPositionProfit of each study.
Have you tried to print out the OpenPositionProfit of the second study without use of GV?
In our environment we have a correct calculation of Portfolio_OpenPositionProfit without using GV.
Please have a look at the attached screenshot.
Hello Henry,
Thank you for the reply.
May you please perform the same check, but with two stategies in the portfolio (on the picture i can see you have 1 strategy with two studys in your PF). I have two strategys with same study and in both cases the same instrument (to have orders in different directions).
I'll review your suggestion about the "print out the OpenPositionProfit of the second study without use of GV"
Thanks a lot
Tsserver.exe is frequently not shutting down, after about 15 mins I close the process but then risk losing data.
It happened with previous releases but seems to be getting worse.
Is there a likely cause of the problem.
It happened with previous releases but seems to be getting worse.
Is there a likely cause of the problem.
-
Henry MultiСharts
- Posts: 9165
- Joined: Aug 25 2011
- Has thanked: 1264 times
- Been thanked: 2958 times
Hello bailey,May you please perform the same check, but with two stategies in the portfolio (on the picture i can see you have 1 strategy with two studys in your PF). I have two strategys with same study and in both cases the same instrument (to have orders in different directions).
This test case did not show any problem as well. Please refer to the attached screenshot.
- Attachments
-
- opp_opp_p2.png
- (60.68 KiB) Downloaded 5115 times
-
Henry MultiСharts
- Posts: 9165
- Joined: Aug 25 2011
- Has thanked: 1264 times
- Been thanked: 2958 times
Hello jl12,Tsserver.exe is frequently not shutting down, after about 15 mins I close the process but then risk losing data.
It happened with previous releases but seems to be getting worse.
Is there a likely cause of the problem.
Which data feed and broker do you use? Is Tsserver.exe the only process that is not shutting down after MC is closed? Is there any antivirus software installed on your PC? Are MultiCharts folders and processes added to the white list of your antivirus? Have you tried to disable/uninstall your antivirus-is the problem still reproduced?
If this solution didn't help please create a dump of Tsserver.exe and send it to me for analysis (support@multicharts.com).
I use IB
Tsserver.exe seems to be the last process left, others are very slow to close, Andrew has looked at connection problems today on live support and has suggested the volume of data might not be helping.
I will check the antivirus and send a dump if the issue persists.
Tsserver.exe seems to be the last process left, others are very slow to close, Andrew has looked at connection problems today on live support and has suggested the volume of data might not be helping.
I will check the antivirus and send a dump if the issue persists.
Last edited by jl12 on Feb 13 2013, edited 1 time in total.
-
eztraderjr

- Posts: 18
- Joined: Sep 02 2012
- Has thanked: 5 times
I am having intermittent issues with some stock symbols not updating real time in intraday charts. Today, I have 2 stocks that will not show real time changes in an intraday chart but they will show the changes in a daily chart. I can get snapshots of the current last price in an intraday chart with all bars being correct if I change the symbol and then change back again. It will then have all bars correct up to the point where it was opened, but it will not continue to update. The radarscreen continues to update properly and charts that are not intraday do as well. Yesterday, I had the same issue with a different symbol. Today that symbol works correctly (every day I reboot my system). I tried to delete the data through quotemanager and then reload all data, but it did not correct the issue. I never experienced this with the current approved release, so I believe it is only in the RC.
-
Henry MultiСharts
- Posts: 9165
- Joined: Aug 25 2011
- Has thanked: 1264 times
- Been thanked: 2958 times
Hello eztraderjr,I am having intermittent issues with some stock symbols not updating real time in intraday charts. Today, I have 2 stocks that will not show real time changes in an intraday chart but they will show the changes in a daily chart. I can get snapshots of the current last price in an intraday chart with all bars being correct if I change the symbol and then change back again. It will then have all bars correct up to the point where it was opened, but it will not continue to update. The radarscreen continues to update properly and charts that are not intraday do as well. Yesterday, I had the same issue with a different symbol. Today that symbol works correctly (every day I reboot my system). I tried to delete the data through quotemanager and then reload all data, but it did not correct the issue. I never experienced this with the current approved release, so I believe it is only in the RC.
Which data source do you use? Which intraday resolution do you use (tick or minute based)?
-
eztraderjr
- Posts: 18
- Joined: Sep 02 2012
- Has thanked: 5 times
Hello eztraderjr,
Which data source do you use? Which intraday resolution do you use (tick or minute based)?
It is minute based from IB...as an aside, if I select to display "Last" in the status line from the format window options, then the correct last price is displayed. So the data can get to the chart, but it is not updating the chart. I did find that one of the stocks from yesterday that had issues also has issues today. So perhaps there is a data problem. I have tried to delete the data and reload, but that seems to have no affect. Thanks.
I have had a similar problem on a daily barchart (stock) using IBHello eztraderjr,
Which data source do you use? Which intraday resolution do you use (tick or minute based)?
It is minute based from IB...as an aside, if I select to display "Last" in the status line from the format window options, then the correct last price is displayed. So the data can get to the chart, but it is not updating the chart. I did find that one of the stocks from yesterday that had issues also has issues today. So perhaps there is a data problem. I have tried to delete the data and reload, but that seems to have no affect. Thanks.
Not sure if this problem is caused by MC 8.5 RC or IB. Just had a spike price print on EUR.USD symbol up to a value of 6.0000 then immediately back to the normal value of 1.3440 level. Chart scale is now from 6.0000 to 1.0880 so can't see normal price bars. Is there any way to fix price prints? See attached screen print.
- Attachments
-
- MC_EUR_USD.png
- price print
- (56.59 KiB) Downloaded 5036 times
Not sure if this problem is caused by MC 8.5 RC or IB. Just had a spike price print on EUR.USD symbol up to a value of 6.0000 then immediately back to the normal value of 1.3440 level. Chart scale is now from 6.0000 to 1.0880 so can't see normal price bars. Is there any way to fix price prints? See attached screen print.
Have look at post #13, Henry has suggested a solution for such issues.
viewtopic.php?f=1&t=10495
-
Henry MultiСharts
- Posts: 9165
- Joined: Aug 25 2011
- Has thanked: 1264 times
- Been thanked: 2958 times
It is minute based from IB...as an aside, if I select to display "Last" in the status line from the format window options, then the correct last price is displayed. So the data can get to the chart, but it is not updating the chart. I did find that one of the stocks from yesterday that had issues also has issues today. So perhaps there is a data problem. I have tried to delete the data and reload, but that seems to have no affect. Thanks.
eztraderjr, thutch,I have had a similar problem on a daily barchart (stock) using IB
How many symbols do you use? In TWS press Ctrl + Alt + "=" to show maximum allowed and currently subscribed symbol count.
If the limitation is not reached:
Please re-add the symbol from the data source.
In QuoteManager please go to Instrument tab->Add symbol->From data source-> IB.
Make sure the instrument session settings are the same as in IB Contract Details.
Plot a new chart for this instrument.
If an intra-day chart is still not updating:
1) Are there any error messages in QuoteManager event log regarding the symbols that are not updating?
2) Right click on the symbol in Quotemanager->Fields to collect->check "Trade - Tick". Right click on the symbol->Connect symbol. Are the quotes being received in "Collect RT data w/o plotting"?
3) Have you tried to set the session for the problem chart to 24/7 (Format->Instrument->Settings tab)?
4) Plot the same chart in IB TWS-Is it updating?
If this solution didn't help and you still have the issue-please come to our live chat Monday-Friday 6:30 am - 4 pm EST to demonstrate the issue remotely and we will collect all required for analysis information.
-
Henry MultiСharts
- Posts: 9165
- Joined: Aug 25 2011
- Has thanked: 1264 times
- Been thanked: 2958 times
First of all "Generate a new tick if Total Volume changes" option should be enabled in QuoteManager->Tools->Data sources->IB->Settings. Restart of all MC processes is required to make the setting come into effect.Not sure if this problem is caused by MC 8.5 RC or IB. Just had a spike price print on EUR.USD symbol up to a value of 6.0000 then immediately back to the normal value of 1.3440 level. Chart scale is now from 6.0000 to 1.0880 so can't see normal price bars. Is there any way to fix price prints? See attached screen print.
For all users that are still receiving realtime spikes with the option enabled:
Our developer has created an updater with extended IB realtime data logging for MultiCharts 8.5 Release Candidate.
Please download the file corresponding to your version of MultiCharts and unzip it into a new folder on your PC:
32bit: https://dl.dropbox.com/u/27918922/MC_IB_80x32_log.zip
64bit: https://dl.dropbox.com/u/27918922/MC_IB_80x64_log.zip
Follow the installation guide.
Once a realtime spike appears on your chart please send me (support@multicharts.com) the following information for analysis:
0) Do not restart MultiCharts in order not to erase the logs.
1) Collect MultiCharts logs. Go to Start --> Run
Paste the following line
32bit: USERPROFILE%\Local Settings\Application Data\TS Support\MultiCharts\
64bit: USERPROFILE%\Local Settings\Application Data\TS Support\MultiCharts64\
Press enter. Compress to zip all folders except Cache folder. Extended logging is stored in TS_DATAFEEDS.LOG, do not miss it.
2) Create a screenshot of your screen so that the bar’s OHLC values and date/time are seen in the data window or chart hint. Specify whether the chart is in Exchange time or your Local PC time (what is PC time zone?).
3) What is the version of TWS you are running ? (TWS Help tab->About)
4) What is your IB account type? Demo/Simulated/Real?
If the logs are >10mb please upload them to any cloud storage service and email me the download link.
You can also come to our live chat Monday-Friday 6:30 am - 4 pm EST to demonstrate the issue remotely and we will collect all required for analysis information.
-
eztraderjr
- Posts: 18
- Joined: Sep 02 2012
- Has thanked: 5 times
Henry,eztraderjr, thutch,
How many symbols do you use? In TWS press Ctrl + Alt + "=" to show maximum allowed and currently subscribed symbol count.
If the limitation is not reached:
Please re-add the symbol from the data source.
In QuoteManager please go to Instrument tab->Add symbol->From data source-> IB.
Make sure the instrument session settings are the same as in IB Contract Details.
Plot a new chart for this instrument.
If an intra-day chart is still not updating:
1) Are there any error messages in QuoteManager event log regarding the symbols that are not updating?
2) Right click on the symbol in Quotemanager->Fields to collect->check "Trade - Tick". Right click on the symbol->Connect symbol. Are the quotes being received in "Collect RT data w/o plotting"?
3) Have you tried to set the session for the problem chart to 24/7 (Format->Instrument->Settings tab)?
4) Plot the same chart in IB TWS-Is it updating?
If this solution didn't help and you still have the issue-please come to our live chat Monday-Friday 6:30 am - 4 pm EST to demonstrate the issue remotely and we will collect all required for analysis information.
I got it to work this morning finally. Deleting the data did not work, but by deleting the symbol and then adding again, it started to finally work. Thanks for your assistance.
As an aside, on the RC I have noticed one other item that is different from the release version. I have some EMAs that I plot intraday. I also set up my charts with a link so that I can change them using the market scanner. When I change to another symbol, the EMA info in the status line will show an older symbols EMA values. It does not change until I actually select the chart window with my cursor. A minor bug, but thought I would pass it on.
-
CrazyNasdaq

- Posts: 326
- Joined: Sep 02 2009
- Location: ITALY
- Has thanked: 101 times
- Been thanked: 90 times
Mine works fine and reload allIs it me or the Reload option is not active in RC version?
I'm not being able to reload any chart

-
arnie
- Posts: 1594
- Joined: Feb 11 2009
- Location: Portugal
- Has thanked: 481 times
- Been thanked: 514 times
Very strange indeed.Mine works fine and reload all
I closed the workspace I was using, created a new one and this time the Reload option was active.
Opened once again the prior workspace and the Reload option was still active.
What happened?
-
Henry MultiСharts
- Posts: 9165
- Joined: Aug 25 2011
- Has thanked: 1264 times
- Been thanked: 2958 times
This issue has been confirmed. It will be fixed in MultiCharts 8.5 Release.As an aside, on the RC I have noticed one other item that is different from the release version. I have some EMAs that I plot intraday. I also set up my charts with a link so that I can change them using the market scanner. When I change to another symbol, the EMA info in the status line will show an older symbols EMA values. It does not change until I actually select the chart window with my cursor. A minor bug, but thought I would pass it on.
-
Henry MultiСharts
- Posts: 9165
- Joined: Aug 25 2011
- Has thanked: 1264 times
- Been thanked: 2958 times
That is possible if one of the charts for this symbol is Reloading or Backfilling at the moment.Is it me or the Reload option is not active in RC version? I'm not being able to reload any chart
Once Reloading/Backfilling is finished-the Reload reature in View tab becomes available.
-
arnie
- Posts: 1594
- Joined: Feb 11 2009
- Location: Portugal
- Has thanked: 481 times
- Been thanked: 514 times
Did anyone tried print a chart with 8.5?
Print preview shows the chart on full A4 paper size but after being printed I get a real small chart on the page top left.
Can't see nothing different on my printer settings that would make the chart this small.
Print preview shows the chart on full A4 paper size but after being printed I get a real small chart on the page top left.
Can't see nothing different on my printer settings that would make the chart this small.
-
Henry MultiСharts
- Posts: 9165
- Joined: Aug 25 2011
- Has thanked: 1264 times
- Been thanked: 2958 times
I have tried that on MC 8.5 RC x32 and x64 bit-all charts are printed full size (A4), no such problem.Did anyone tried print a chart with 8.5?
Print preview shows the chart on full A4 paper size but after being printed I get a real small chart on the page top left.
Can't see nothing different on my printer settings that would make the chart this small.
Can you try it on a different PC or printer?
-
arnie
- Posts: 1594
- Joined: Feb 11 2009
- Location: Portugal
- Has thanked: 481 times
- Been thanked: 514 times
I have tried that on MC 8.5 RC x32 and x64 bit-all charts are printed full size (A4), no such problem.Did anyone tried print a chart with 8.5?
Print preview shows the chart on full A4 paper size but after being printed I get a real small chart on the page top left.
Can't see nothing different on my printer settings that would make the chart this small.
Can you try it on a different PC or printer?
Strange thing.
My printer was not set as default.
I would choose it and I would get that small chart print.
After making it as default it started to print full screen.
I then remove it from default to test if I would get that small print again but this time it printed full screen so... I really don't know what to say....