
MultiCharts 8.8 Beta 1 contains many of the new features that you have been waiting for, Advanced Market Scanner, MultiCharts Desktops that allows you to save MultiCharts layouts on each monitor, Dynamic Order Name that generates an order name based on script calculation. Now you have the flexibility in plotting daily data with different session templates at the same time because daily bars can be formed out of minute data. An indicator can base on values of another indicator and Limit Order Execution Assumptions is available in Portfolio Backtester. MultiCharts 8.8 Beta 1 also has an improved optimization process, improved dialog windows and broker connections from Avanza and other new brokers working through CQG.
Make sure you ask our support if you have any questions.
Learn more
MULTICHARTS 8.8 BETA 1
-
arnie

- Posts: 1594
- Joined: Feb 11 2009
- Location: Portugal
- Has thanked: 481 times
- Been thanked: 514 times
Is it possible to make the High and Low a bit more pronounced? It's too small, almost invisible.
Maybe extend it into the bid and ask columns also.
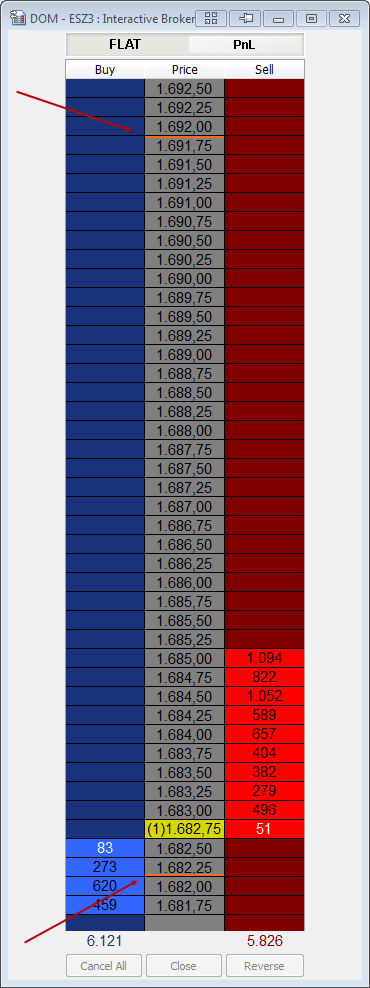
Also, This high and low is for the 24h session (ETH + RTH).
Is there a way for us to switch it to RTH only after the pit market opens?
Where is the cumulative volume on the DOM? In PM it says that it's implemented but I can't find it.
Maybe extend it into the bid and ask columns also.
Also, This high and low is for the 24h session (ETH + RTH).
Is there a way for us to switch it to RTH only after the pit market opens?
Where is the cumulative volume on the DOM? In PM it says that it's implemented but I can't find it.
- Attachments
-
- DOM_hilo.png
- (34.52 KiB) Downloaded 7187 times
-
arnie
- Posts: 1594
- Joined: Feb 11 2009
- Location: Portugal
- Has thanked: 481 times
- Been thanked: 514 times
It seems Price columns size is not enough since it's "eating" 2 characters.
Only with a font size of seven I was able to see all characters.
The bigger the font the less you see.
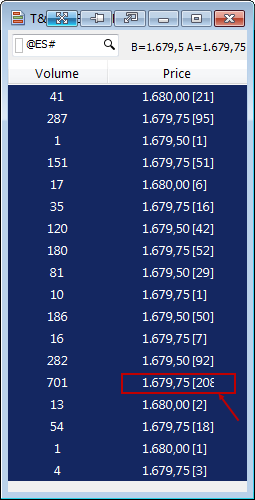
I would love to be able to narrow this window more because there's too much empty space in there.
Only with a font size of seven I was able to see all characters.
The bigger the font the less you see.
I would love to be able to narrow this window more because there's too much empty space in there.
- Attachments
-
- TS_cell.png
- (16.71 KiB) Downloaded 7122 times
-
Dave Masalov

- Posts: 1712
- Joined: Apr 16 2010
- Has thanked: 51 times
- Been thanked: 490 times
Hello arnie,It seems Price columns size is not enough since it's "eating" 2 characters.
Only with a font size of seven I was able to see all characters.
The bigger the font the less you see.
I would love to be able to narrow this window more because there's too much empty space in there.
The issue has been confirmed and added to our fix list. Thank you for reporting.
-
Dave Masalov
- Posts: 1712
- Joined: Apr 16 2010
- Has thanked: 51 times
- Been thanked: 490 times
Is it possible to make the High and Low a bit more pronounced? It's too small, almost invisible.
Maybe extend it into the bid and ask columns also.
I think it looks better if the bracket of trades could be placed behind the volume instead behind the price.
Hello,
Thank you for your comments. It depends on your personal preferences and trading style. Your suggestions have been forwarded to the developers and will be considered for future implementation.
-
arnie
- Posts: 1594
- Joined: Feb 11 2009
- Location: Portugal
- Has thanked: 481 times
- Been thanked: 514 times
I think it looks better if the bracket of trades could be placed behind the volume instead behind the price.I would love to be able to narrow this window more because there's too much empty space in there.
Actually, as I already requested far too many times to remember how many, the number of trades should have their own column so we could choose to show them or not. This way we could also move it to wherever side we want on the T&S window.
Another thing I've been requesting is two volume columns so we could select one for bid and the other for ask volume.
I filter the volume. I aggregate volume traded on the bid and on the ask and put it side by side with the DOM so I can get a "real" reading of what the volume is (or was) on each level.
I change between two setups, this one
and this one
I'm forced to have two T&S windows open because of the lack of that second volume column and because of that I have those two window setups.
None of them are good but of the two the one that have the T&S on top of each other is the preferred one since it's easier to the eyes looking at the bid/ask right on top of each other.
If they were on the same window, side be side it would be even better.
Let say that I'm trying to emulate Jigsaw tools which I find very interesting, having the DOM and T&S on the same window, working together, although to have that type of DOM in MC it could not, in the case of Interactive Brokers, use their data since it's useless.
Brokers using Zenfire or Rithmic data they should be good to work with.
So for IB clients the solution would be IQFeed but but for that MC would need to map the DOM and I don't know how feasible that is.
Last edited by arnie on Oct 02 2013, edited 1 time in total.
-
arnie
- Posts: 1594
- Joined: Feb 11 2009
- Location: Portugal
- Has thanked: 481 times
- Been thanked: 514 times
For the first day or two I use beta just for paper trading, after that, if all goes OK I go live with it.Arnie,
Can I ask if you're finding the beta stable and whether you'd install it for a live trading system at this stage ?
Thanks
Since this version has new DOM features I'll have extra careful but I confess that I really never had big issues with beta versions.
And since I have always TWS opened, if some drastic error occurs I can easily manage the trade on TWS.
-
TJ

- Posts: 7775
- Joined: Aug 29 2006
- Location: Global Citizen
- Has thanked: 1036 times
- Been thanked: 2233 times
please note the meaning and purpose of a BETA release
http://en.wikipedia.org/wiki/Software_r ... life_cycle
http://en.wikipedia.org/wiki/Software_r ... life_cycle
-
Dave Masalov
- Posts: 1712
- Joined: Apr 16 2010
- Has thanked: 51 times
- Been thanked: 490 times
Hello mobelby,Arnie,
Can I ask if you're finding the beta stable and whether you'd install it for a live trading system at this stage ?
Thanks
It is a Beta version and it has some known issues that will be fixed shortly. We do not recommend you to trade live with this version.
-
shanemcdonald

- Posts: 196
- Joined: Aug 08 2012
- Has thanked: 41 times
- Been thanked: 41 times
cqg does not work properly through amp.
rithmic will not connect either. apparently there is a new trade route number in the rithmic api that MC support does not know.
unable to use it so far.
support told me I did not have to change cqg api for amp.
rithmic will not connect either. apparently there is a new trade route number in the rithmic api that MC support does not know.
unable to use it so far.
support told me I did not have to change cqg api for amp.
-
Henry MultiСharts

- Posts: 9165
- Joined: Aug 25 2011
- Has thanked: 1264 times
- Been thanked: 2958 times
Please specify the particular issue you have.cqg does not work properly through amp.
There is no universal setting for that. What is the connection error message you have in File -> New -> Order and position tracker window -> Logs tab?rithmic will not connect either. apparently there is a new trade route number in the rithmic api that MC support does not know.

I asked for this in the last version. Dave replied "Your request has been forwarded to the developers and will be considered for future implementation."
I would love to be able to narrow this window more because there's too much empty space in there.
It is a disappointment not to see it in 8.8 as it does waste so much valuable screen space.
-
arnie
- Posts: 1594
- Joined: Feb 11 2009
- Location: Portugal
- Has thanked: 481 times
- Been thanked: 514 times
I asked for this in the last version. Dave replied "Your request has been forwarded to the developers and will be considered for future implementation."
It is a disappointment not to see it in 8.8 as it does waste so much valuable screen space.
I don't know if you remember but T&S first versions we were able to make it narrower.
The problem with it at the time were those 3 buttons on the heather that would become unavailable. So they locked the window size, resolving the button issues.
One of the ways to resolve this would be remove them from the header and make them available through the right mouse menu, where, the the Compact/Full mode option is already there, so they would only need to add the Stick and the Attached options.
So removing those 3 buttons we would be free of the problem of narrowing the window and those buttons becoming unavailable.
Naturally that the problem might be something more complicated than just remove three simple buttons, something related to the MC UI itself that has some limitations not yet addressed.
Anyway, I'm certain that sooner or later this will be addressed, we just need to wait... At least, it seems they finally fixed the annoying T&S column size, although I'm still getting some small issues with it but definitely it's way better than it was.
- Attachments
-
- TS_buttons.png
- (14.36 KiB) Downloaded 7084 times
-
shanemcdonald
- Posts: 196
- Joined: Aug 08 2012
- Has thanked: 41 times
- Been thanked: 41 times
rithmic sent message telling me to reboot system , and then the automatic lookup button will work.Please specify the particular issue you have.cqg does not work properly through amp.
There is no universal setting for that. What is the connection error message you have in File -> New -> Order and position tracker window -> Logs tab?rithmic will not connect either. apparently there is a new trade route number in the rithmic api that MC support does not know.
it is in the rithmic broker profile settings under trade route number which is new.
That worked !
CQG does not have historical tick data now. When I create a tick chart, the data begins right there at moment of chart creation. It used to go back several months
after updating the build today, the tick data now loads for today going back to midnight.
Is that how cqg will be now ?
-
sptrader
- Posts: 742
- Joined: Apr 09 2010
- Location: Texas
- Has thanked: 483 times
- Been thanked: 274 times
- Contact:
Today(10/3) at 3:30pm est, I received the following message from MC.
"Dear MultiCharts Customer,
Since the moment the latest MultiCharts 8.8 beta 1 there had been reported couple of minor issues and we reassembled the beta 1 in order to allow all customer get a more stable beta version. Please re-download the version and update your currently installed one:"
this is for the 32bit AND 64bit versions of 8.8beta1..
-
Dave Masalov
- Posts: 1712
- Joined: Apr 16 2010
- Has thanked: 51 times
- Been thanked: 490 times
Hello sptrader,Today(10/3) at 3:30pm est, I received the following message from MC.
"Dear MultiCharts Customer,
Since the moment the latest MultiCharts 8.8 beta 1 there had been reported couple of minor issues and we reassembled the beta 1 in order to allow all customer get a more stable beta version. Please re-download the version and update your currently installed one:"
this is for the 32bit AND 64bit versions of 8.8beta1..
Indeed, we fixed a couple of issues and reassembled Mc 8.8 Beta 1. All registered users using previous builds were notified by e-mail. Please make sure that you use build 7993 or 7994.
-
evdl
- Posts: 401
- Joined: Jan 19 2011
- Location: Netherlands
- Has thanked: 85 times
- Been thanked: 125 times
Updated to MC 8.8. beta 1 build 7994 (64bit).
Using IB latest TWS and latest java on windows 7.
Running into some trouble. I have a chart with 50 ticks as data 1 and 30 minute as data2 (which is hided).
The charts are not showing any bars anymore. But you can still see my moving average (see picture) on the chart, but no bars. Sometimes it will show the bars for a couple of minutes and then it disappears again. Or if you fiddle around with the data2 and set it on hide and unhide. The bars also appear again.
Update: build up the chart again. All bars are on the chart at that moment. When forming a new bar (after 50 ticks in this case) the bars disappear. Then change hide of data2 to unhide and back to hide. And then the bars are on the chart again, until next new bar.
- Attachments
-
- chart with bars.png
- (92.54 KiB) Downloaded 6077 times
-
- Chart no bars.png
- (82.01 KiB) Downloaded 6055 times
-
Henry MultiСharts
- Posts: 9165
- Joined: Aug 25 2011
- Has thanked: 1264 times
- Been thanked: 2958 times
Hello evdl,Updated to MC 8.8. beta 1 build 7994 (64bit).
Using IB latest TWS and latest java on windows 7.
Running into some trouble. I have a chart with 50 ticks as data 1 and 30 minute as data2 (which is hided).
The charts are not showing any bars anymore. But you can still see my moving average (see picture) on the chart, but no bars. Sometimes it will show the bars for a couple of minutes and then it disappears again. Or if you fiddle around with the data2 and set it on hide and unhide. The bars also appear again.
Update: build up the chart again. All bars are on the chart at that moment. When forming a new bar (after 50 ticks in this case) the bars disappear. Then change hide of data2 to unhide and back to hide. And then the bars are on the chart again, until next new bar.
This issue has been confirmed. It will be resovled in MultiCharts 8.8 Beta 2.
-
Henry MultiСharts
- Posts: 9165
- Joined: Aug 25 2011
- Has thanked: 1264 times
- Been thanked: 2958 times
This case has not been replicated on our end. In MultiCharts please go to File tab->Preferences->Data server mode; Make sure you are in online mode, "download missing historical data" is enabled. Please also make sure that "Merge data sources into a single chart" is disabled in Format->Instrument->Instrument tab.CQG does not have historical tick data now. When I create a tick chart, the data begins right there at moment of chart creation. It used to go back several months
after updating the build today, the tick data now loads for today going back to midnight.
Is that how cqg will be now ?
-
Henry MultiСharts
- Posts: 9165
- Joined: Aug 25 2011
- Has thanked: 1264 times
- Been thanked: 2958 times
The LastBarOnChart function returns True if the study is calculated on the last charted bar. False if not. How exactly do you want to have this function improved?With the new drawings according to the bar number is it posible to get a new
lastbaronchart function too with lastbaronchart_bn to check if it is the last completed barnumber bar ?
Hi Henry,
it is not urgent.
If you use a 1 tick chart on a fast market lastbaronchart turns true for multiple bars.
I.e. use a 1 tick ES chart when the markets move fast with
and then turn status off and back on there will be multiple text plots and plot1, not only one. With lastbaronchart_s you could reduce that more, but lastbaronchart_s will be true still for more than one bar, namely for the whole second.
I think TS introduced the keyword LastBarOnChartEX for tick charts.
PS: it would be nice if a text_setlocation_bn function could be added to move an existing text_new_bn.
it is not urgent.
If you use a 1 tick chart on a fast market lastbaronchart turns true for multiple bars.
I.e. use a 1 tick ES chart when the markets move fast with
Code: Select all
If lastbaronchart and BarStatus(1) = 2 then

Begin

   Value1 = Text_New_bn( currentbar, High - (Range/2), "Bars" );

   Text_SetStyle(Value1, 0, 2);

   Text_SetColor(Value1, White);

   plot1 (1);

End; I think TS introduced the keyword LastBarOnChartEX for tick charts.
PS: it would be nice if a text_setlocation_bn function could be added to move an existing text_new_bn.
-
Henry MultiСharts
- Posts: 9165
- Joined: Aug 25 2011
- Has thanked: 1264 times
- Been thanked: 2958 times
Is it possible to make the High and Low a bit more pronounced? It's too small, almost invisible. Maybe extend it into the bid and ask columns also.Also, This high and low is for the 24h session (ETH + RTH). Is there a way for us to switch it to RTH only after the pit market opens?
I would love to be able to narrow this window more because there's too much empty space in there.
I think it looks better if the bracket of trades could be placed behind the volume instead behind the price.
Thank you for your suggestions. All feature requests are forwarded to the management of the company and are evaluated in a timely manner. Please note that even though we value your opinion not all requests can be implemented due to the fact that some features do not fit into our current roadmap.Actually, as I already requested far too many times to remember how many, the number of trades should have their own column so we could choose to show them or not. This way we could also move it to wherever side we want on the T&S window. Another thing I've been requesting is two volume columns so we could select one for bid and the other for ask volume.
Try the following
Code: Select all
If CheckAlert Then // you need to turn on alert even if you don't use it within your code for this to work

Begin

   Value1 = Text_New_bn( currentbar, High - (Range/2), "Bars" );

   Text_SetStyle(Value1, 0, 2);

   Text_SetColor(Value1, White);

   plot1 (1);

End; -
evdl
- Posts: 401
- Joined: Jan 19 2011
- Location: Netherlands
- Has thanked: 85 times
- Been thanked: 125 times
Exporting data to ascii in Quotemanager is displaying and exporting faulty volume values.
For example export tick data to ascii and volume values are not the same as if you look at the same symbol via "edit data".
Please look at the attached pictures.
For example export tick data to ascii and volume values are not the same as if you look at the same symbol via "edit data".
Please look at the attached pictures.
- Attachments
-
- Wrong volume.png
- (17.09 KiB) Downloaded 6049 times
-
- Right volume.png
- (36.65 KiB) Downloaded 6055 times
Since updating to the latest beta (7994), I'm experiencing an issue that the charts of some symbols are not completely loaded after starting Multicharts. There is a gap between the last bar of the time when MC was shut down the day before and the first bar of starting MC on the following day. The affected symbols are CL, GC, SI, broker and datafeed is IB via TWS. When I manually reload the affected charts, everything works fine. All other symbols are not affected. I've never experienced this issue before the update.
Hi, I'm new to Multicharts, but I've found a little missing in the Volume profile panel.
It's possible to have also a Monthly Volume profile ?

The only way to have it for each month is to load N times the same data and set the Volume Profile from the beginning of the month to its end.......very inconvenient !!!

Congratulations for this fantastic software!!!
It's possible to have also a Monthly Volume profile ?
The only way to have it for each month is to load N times the same data and set the Volume Profile from the beginning of the month to its end.......very inconvenient !!!
Congratulations for this fantastic software!!!
-
Henry MultiСharts
- Posts: 9165
- Joined: Aug 25 2011
- Has thanked: 1264 times
- Been thanked: 2958 times
This issue has been confirmed. The fix is targeted to MultiCharts 8.8 beta 2.Exporting data to ascii in Quotemanager is displaying and exporting faulty volume values.
For example export tick data to ascii and volume values are not the same as if you look at the same symbol via "edit data".
Please look at the attached pictures.
-
Henry MultiСharts
- Posts: 9165
- Joined: Aug 25 2011
- Has thanked: 1264 times
- Been thanked: 2958 times
Seneca, please make sure "Merging Data sources into a single chart" is disabled in Format->Instrument->Instrument tab for your chart.Since updating to the latest beta (7994), I'm experiencing an issue that the charts of some symbols are not completely loaded after starting Multicharts. There is a gap between the last bar of the time when MC was shut down the day before and the first bar of starting MC on the following day. The affected symbols are CL, GC, SI, broker and datafeed is IB via TWS. When I manually reload the affected charts, everything works fine. All other symbols are not affected. I've never experienced this issue before the update.
If this solution didn't help and you still have the issue-please come to our live chat Monday-Friday 6:30 am - 4 pm EST to demonstrate it.
-
Henry MultiСharts
- Posts: 9165
- Joined: Aug 25 2011
- Has thanked: 1264 times
- Been thanked: 2958 times
Hello Ranfotto,Hi, I'm new to Multicharts, but I've found a little missing in the Volume profile panel.
It's possible to have also a Monthly Volume profile ?
The only way to have it for each month is to load N times the same data and set the Volume Profile from the beginning of the month to its end.......very inconvenient !!!
Congratulations for this fantastic software!!!
There are multiple ways to do that: you can use N weeks, N bars, or just add second data series with 1 month resolution and enable volume profile for it.
ASCII mapping of minute data seems much improved, but to me, QuoteManager is still the weakest link of the whole package.
I find that when I run a portfolio backtest on symbols that are mapped using ASCII mapping that there's very little visibility about what's going on behind the scenes- you just wait and wait, and hope that it's behaving.
I find that when I run a portfolio backtest on symbols that are mapped using ASCII mapping that there's very little visibility about what's going on behind the scenes- you just wait and wait, and hope that it's behaving.
-
Henry MultiСharts
- Posts: 9165
- Joined: Aug 25 2011
- Has thanked: 1264 times
- Been thanked: 2958 times
Before using your data in PorftolioBacktester you can plot the same symbols in the Scanner window to check that data availability.ASCII mapping of minute data seems much improved, but to me, QuoteManager is still the weakest link of the whole package.
I find that when I run a portfolio backtest on symbols that are mapped using ASCII mapping that there's very little visibility about what's going on behind the scenes- you just wait and wait, and hope that it's behaving.
-
evdl
- Posts: 401
- Joined: Jan 19 2011
- Location: Netherlands
- Has thanked: 85 times
- Been thanked: 125 times
Memory consumption of multicharts.exe is not cleared completely when loading different periods of tick data.
Say you load a chart with one year of tick data. The memory consumption is about 1.5gb. When you change the periode to 2 days of tick data. The memory consumption stays about 1gb.
But when exporting data on a tick chart with a script like this to file
the memory consumption of the export is not cleared after the export is done and the script is put to off. One export is taking around 5gb of memory. The output file is around 700mb. I don't know if that is unusual. But the clearing of this memory should take place I guess when the script is put to off or even the chart is removed.
The memory consumption of multicharts.exe is getting 5gb bigger with every export of 1 year of data to a file.
The only way of clearing the memory is to close multicharts.exe.
Not sure if this is related to the 8.8 beta release. Because I did not export the same data on Mc8.7. But I thought to just mention it, so it can be checked if possible
Say you load a chart with one year of tick data. The memory consumption is about 1.5gb. When you change the periode to 2 days of tick data. The memory consumption stays about 1gb.
But when exporting data on a tick chart with a script like this to file
Code: Select all
Inputs: Filename_fut("C:\" + "data " + ".txt"); // prints data to file


Print(File(filename_fut), datetimetostring_ms(datetime),",",Close,",",Upticks + downticks);
The memory consumption of multicharts.exe is getting 5gb bigger with every export of 1 year of data to a file.
The only way of clearing the memory is to close multicharts.exe.
Not sure if this is related to the 8.8 beta release. Because I did not export the same data on Mc8.7. But I thought to just mention it, so it can be checked if possible
-
ABC

- Posts: 733
- Joined: Dec 16 2006
- Location: www.abctradinggroup.com
- Has thanked: 126 times
- Been thanked: 415 times
- Contact:
PosTradeIsOpen doesn't seem to work anymore, it always returns false.
You can check it with this simple code:
This will print nothing, although a trade is open.
Regards,
ABC
You can check it with this simple code:
Code: Select all
once Buy this bar Close;


if PosTradeIsOpen(0, 0) = True

then Print(ElDateToString(Date), "; Time: ", Time);Regards,
ABC
-
ABC
- Posts: 733
- Joined: Dec 16 2006
- Location: www.abctradinggroup.com
- Has thanked: 126 times
- Been thanked: 415 times
- Contact:
Multicharts team,
your approach of having hot fixes for issues already fixed is great. It saves time if you can simply apply the hot fix instead of installing a full version that only has a few minor fixes.
However it would be great if existing hot fixes could be made available to the public. This should be accompanied by a list of problems this hot fix cures, too. Let me tell you why I think this is important. I ran into a bug last week and as with every bug you encounter, you first have to find the cause of the problem. This can take quite some time as you are aware of.
After I found the bug, I reported it to you only to be told that you were already aware of the problem and had a hot fix for it ready.
Basically I have wasted my time tracking down something that was already fixed and this could have been avoided when the hot fix was available in the forums. I am sure that this would benefit other users too.
I am also convinced that this might save you time, as you might get less duplicate bug reports this way.
Regards,
ABC
-
Henry MultiСharts
- Posts: 9165
- Joined: Aug 25 2011
- Has thanked: 1264 times
- Been thanked: 2958 times
The issue has been confirmed. The fix is targeted to MultiCharts 8.8 Beta 2Importing a TS eld that contains a function always gives an error.
Error occured during import. ....
Study: "(Function)"
Error code: 1
-
Henry MultiСharts
- Posts: 9165
- Joined: Aug 25 2011
- Has thanked: 1264 times
- Been thanked: 2958 times
This issue has been confirmed. The fix is targeted to MultiCharts 8.8 ReleasePosTradeIsOpen doesn't seem to work anymore, it always returns false.
You can check it with this simple code:
This will print nothing, although a trade is open.Code: Select all
once Buy this bar Close;


if PosTradeIsOpen(0, 0) = True

	then Print(ElDateToString(Date), "; Time: ", Time);
Regards,
ABC
-
evdl
- Posts: 401
- Joined: Jan 19 2011
- Location: Netherlands
- Has thanked: 85 times
- Been thanked: 125 times
When in position (for example 6 futures) and use the "close" button of the chart trading panel. The position is sometimes only partial closed. Leaving you with a position.
The "close" button will normally close the whole position at market. In the order tracker you see for example order name "close position", 4 futures filled. Leaving you with 2 futures.
The buttons of the chart trading are greyed out at that moment and can not be used to also close the remaining position. You have to manually close this in TWS IB.
MC is thinking that there is no position anymore. But it will display the P&L of the two remaining futures on the chart. When manually closed in TWS, the remaining position on the chart is also updated to no position.
It looks like if the position is filled in parts, after the first fill, MC is thinking the whole position is filled and greys out the "close", "reverse", "cancel all" etc. buttons on the trading panel.
Symbolmapping is done for a custome future, linked to the current contract of the future.
-
Henry MultiСharts
- Posts: 9165
- Joined: Aug 25 2011
- Has thanked: 1264 times
- Been thanked: 2958 times
This issue has been confirmed. The fix is targeted to MultiCharts 8.8 ReleaseWhen in position (for example 6 futures) and use the "close" button of the chart trading panel. The position is sometimes only partial closed. Leaving you with a position.
The "close" button will normally close the whole position at market. In the order tracker you see for example order name "close position", 4 futures filled. Leaving you with 2 futures.
The buttons of the chart trading are greyed out at that moment and can not be used to also close the remaining position. You have to manually close this in TWS IB.
MC is thinking that there is no position anymore. But it will display the P&L of the two remaining futures on the chart. When manually closed in TWS, the remaining position on the chart is also updated to no position.
It looks like if the position is filled in parts, after the first fill, MC is thinking the whole position is filled and greys out the "close", "reverse", "cancel all" etc. buttons on the trading panel.
Symbolmapping is done for a custome future, linked to the current contract of the future.
-
Henry MultiСharts
- Posts: 9165
- Joined: Aug 25 2011
- Has thanked: 1264 times
- Been thanked: 2958 times
We are going to have MultiСharts 8.8 Release in November.Henry, What is your target for releasing MC 8.8 production version? November or December? Thanks.This issue has been confirmed. The fix is targeted to MultiCharts 8.8 Release