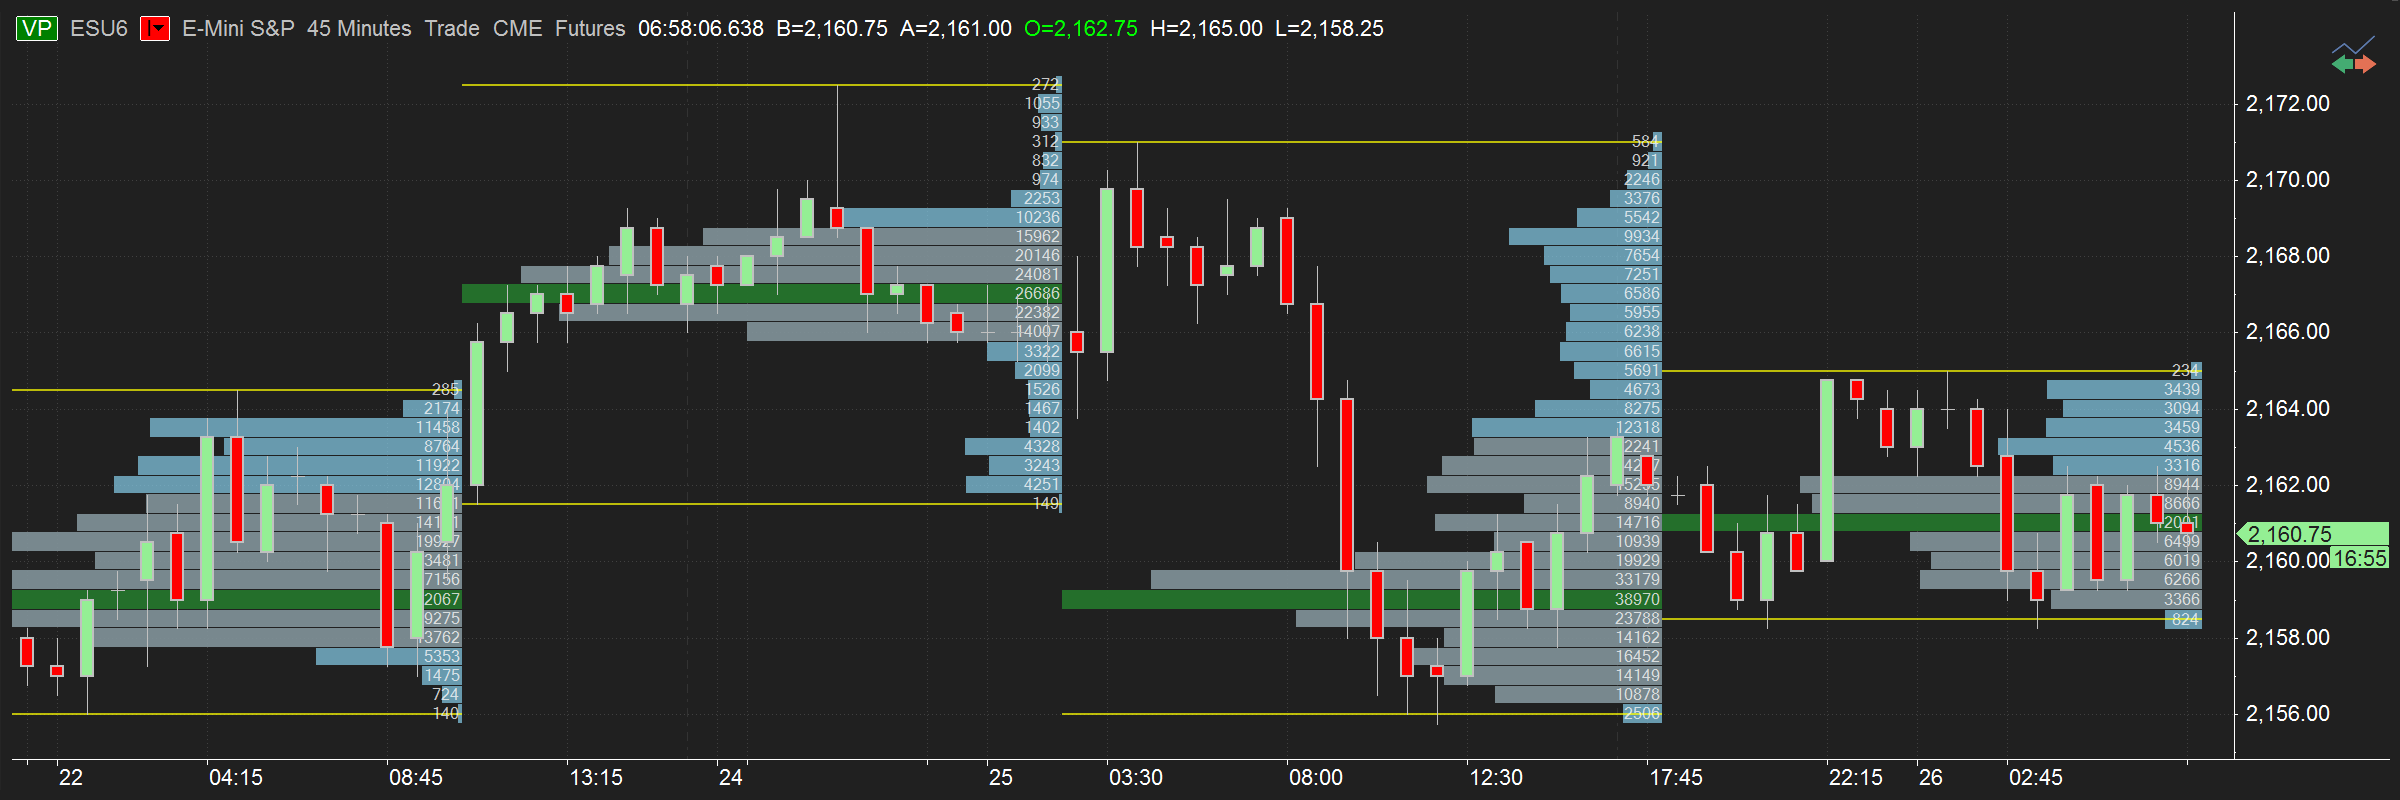
Volume Profile
Volume Profile is a vital tool that shows the most traded prices for a particular time period. It plots volume as a histogram on the price bar, so you can see the levels where you need them.
MultiCharts
Various combinations of volume and tick data
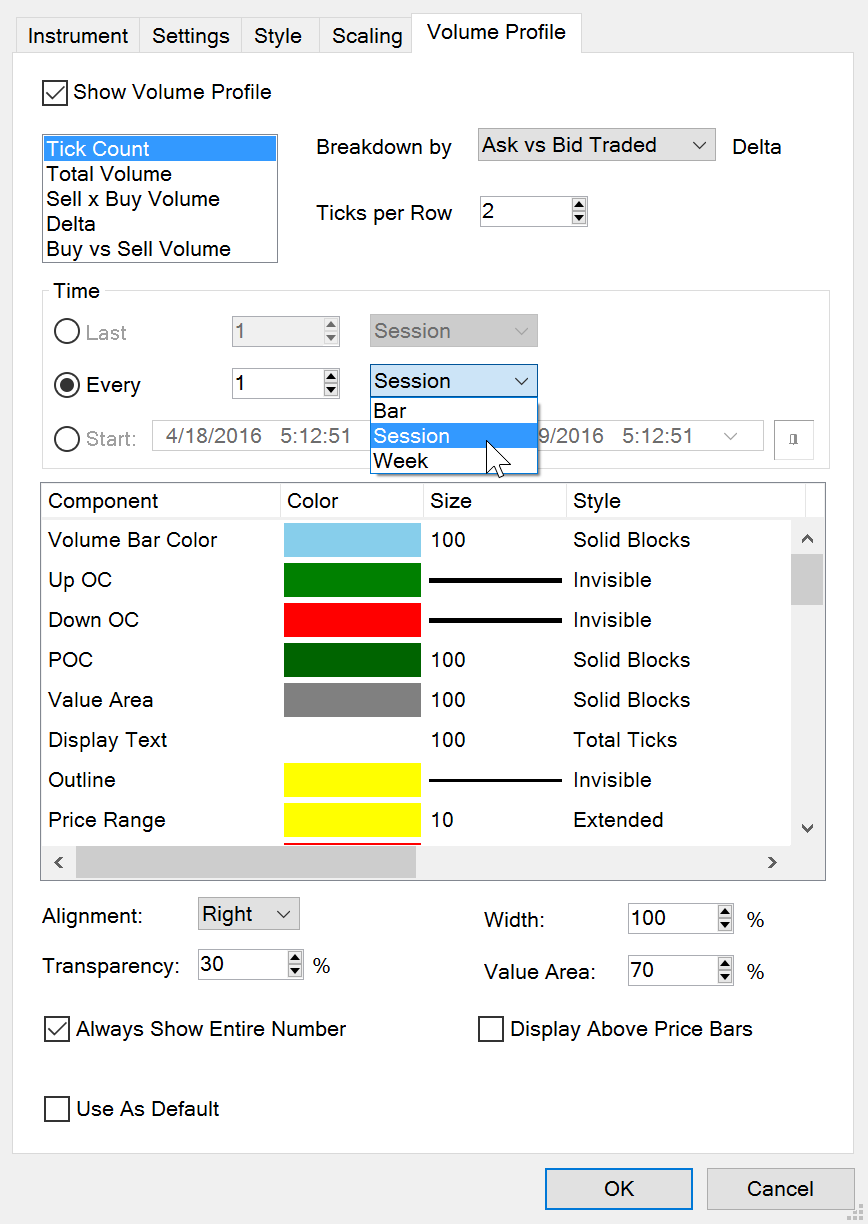
Display option determines the way you arrange the volume data or a group of ticks. There are several ways to show Volume Profile data in MultiCharts: Tick Count, Total Volume, Sell x Buy Volume, Delta option, Buy vs Sell Volume. For example, Total Volume displays ask + bid volume provided by a data source for every tick. If Buy vs Sell option is selected, it displays total volume value in each line and the line is colored in green/red (by default) depending on whether the ask volume is greater or smaller than bid volume. More info on how to set up Volume Profile Display is here.
Two ways to set up Volume Breakdown
There are two methods available in MultiCharts that specify how to differentiate Buy and Sell volume. You can choose either Ask Traded vs Bid Traded or Up Ticks vs Down Ticks option. Ask Traded vs Bid Traded method compares the current tick price with the current Ask or Bid tick price. Up and Down Ticks breakdown uses the comparison of the current and the previous tick price. Learn more details of this option in this article.
Tick-based bid and ask volume
MultiCharts downloads historical trade, ask and bid ticks and locally transforms them into an accurate volume representation. Trade prices are compared to asks and bids to determine at which price the trade happened.
Choose the needed resolution
You can display a volume profile on a per-bar basis, for the session, or for the entire week – all depending on what you are trying to see. Note: when your chart is set to “1 week” or higher resolution, you can only use per-bar setting.
MultiCharts

Format Instrument
Volume Profile
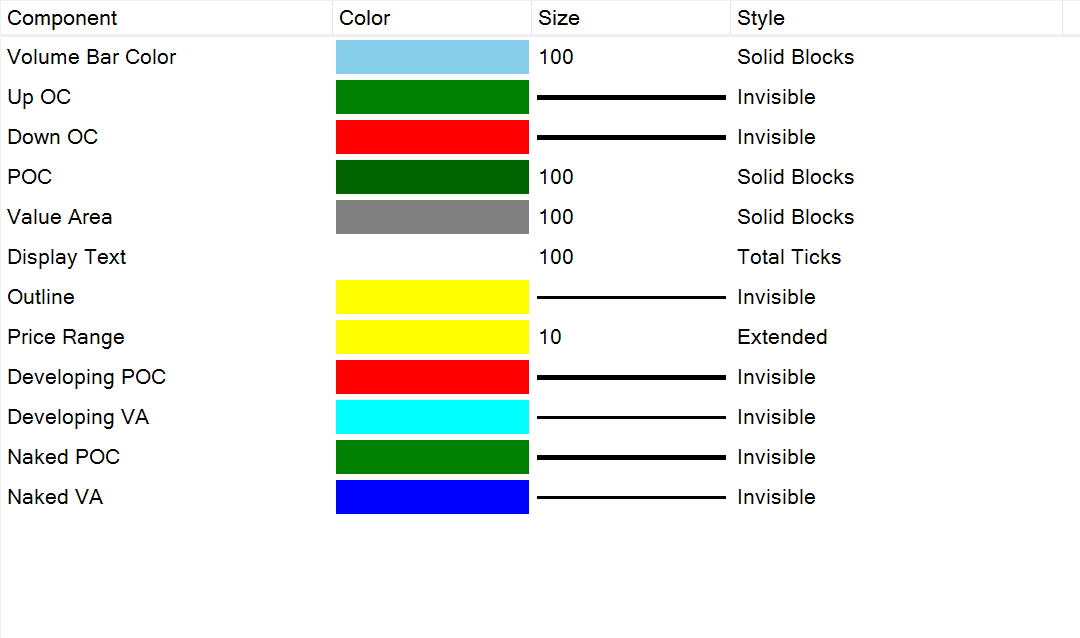
Customize Volume Profile components
You can change to your liking the color, size and style of any component. For complete information about our Volume Profile, visit our Volume Profile article.
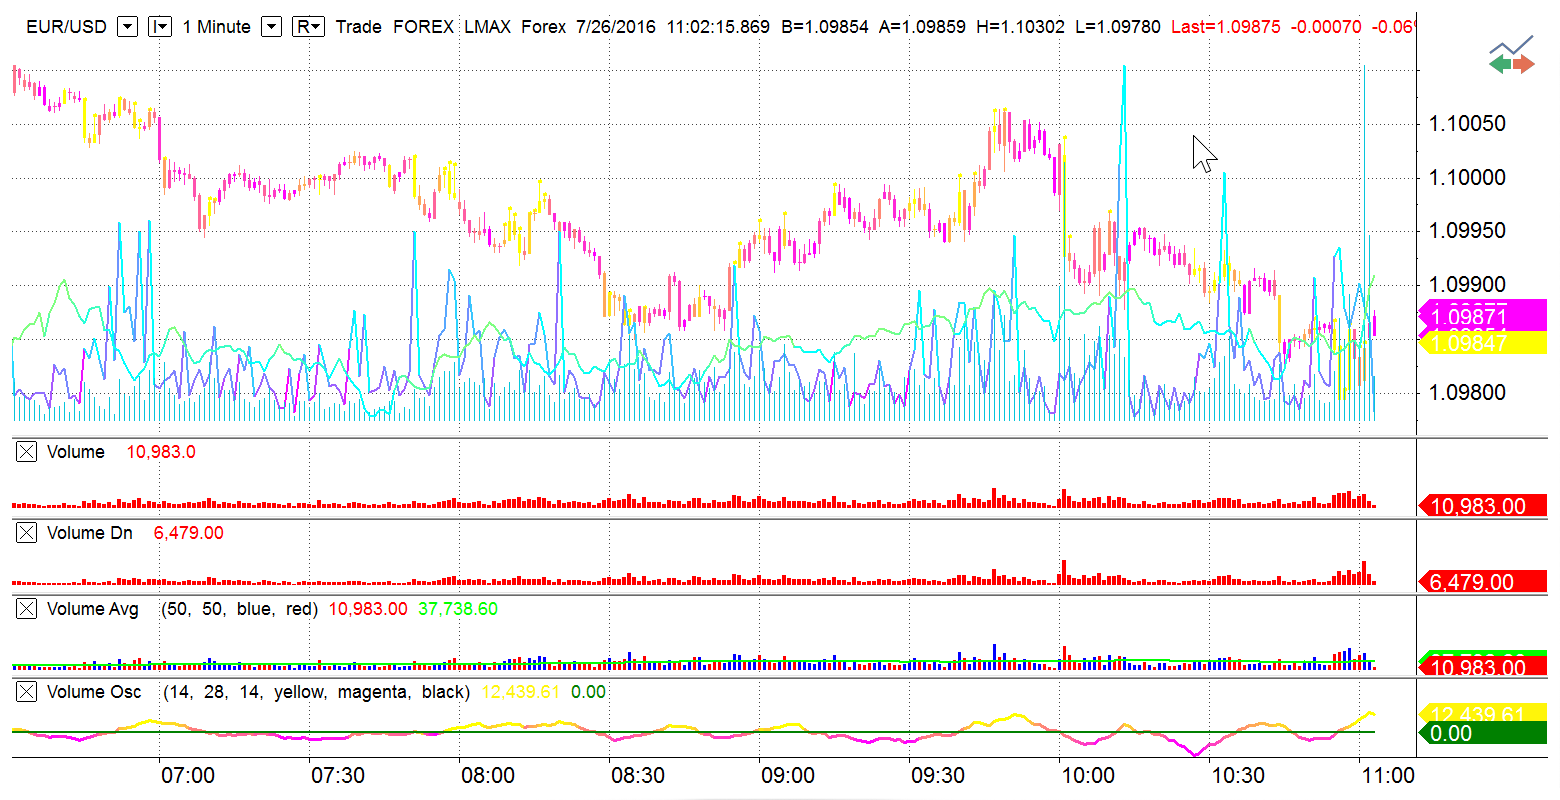
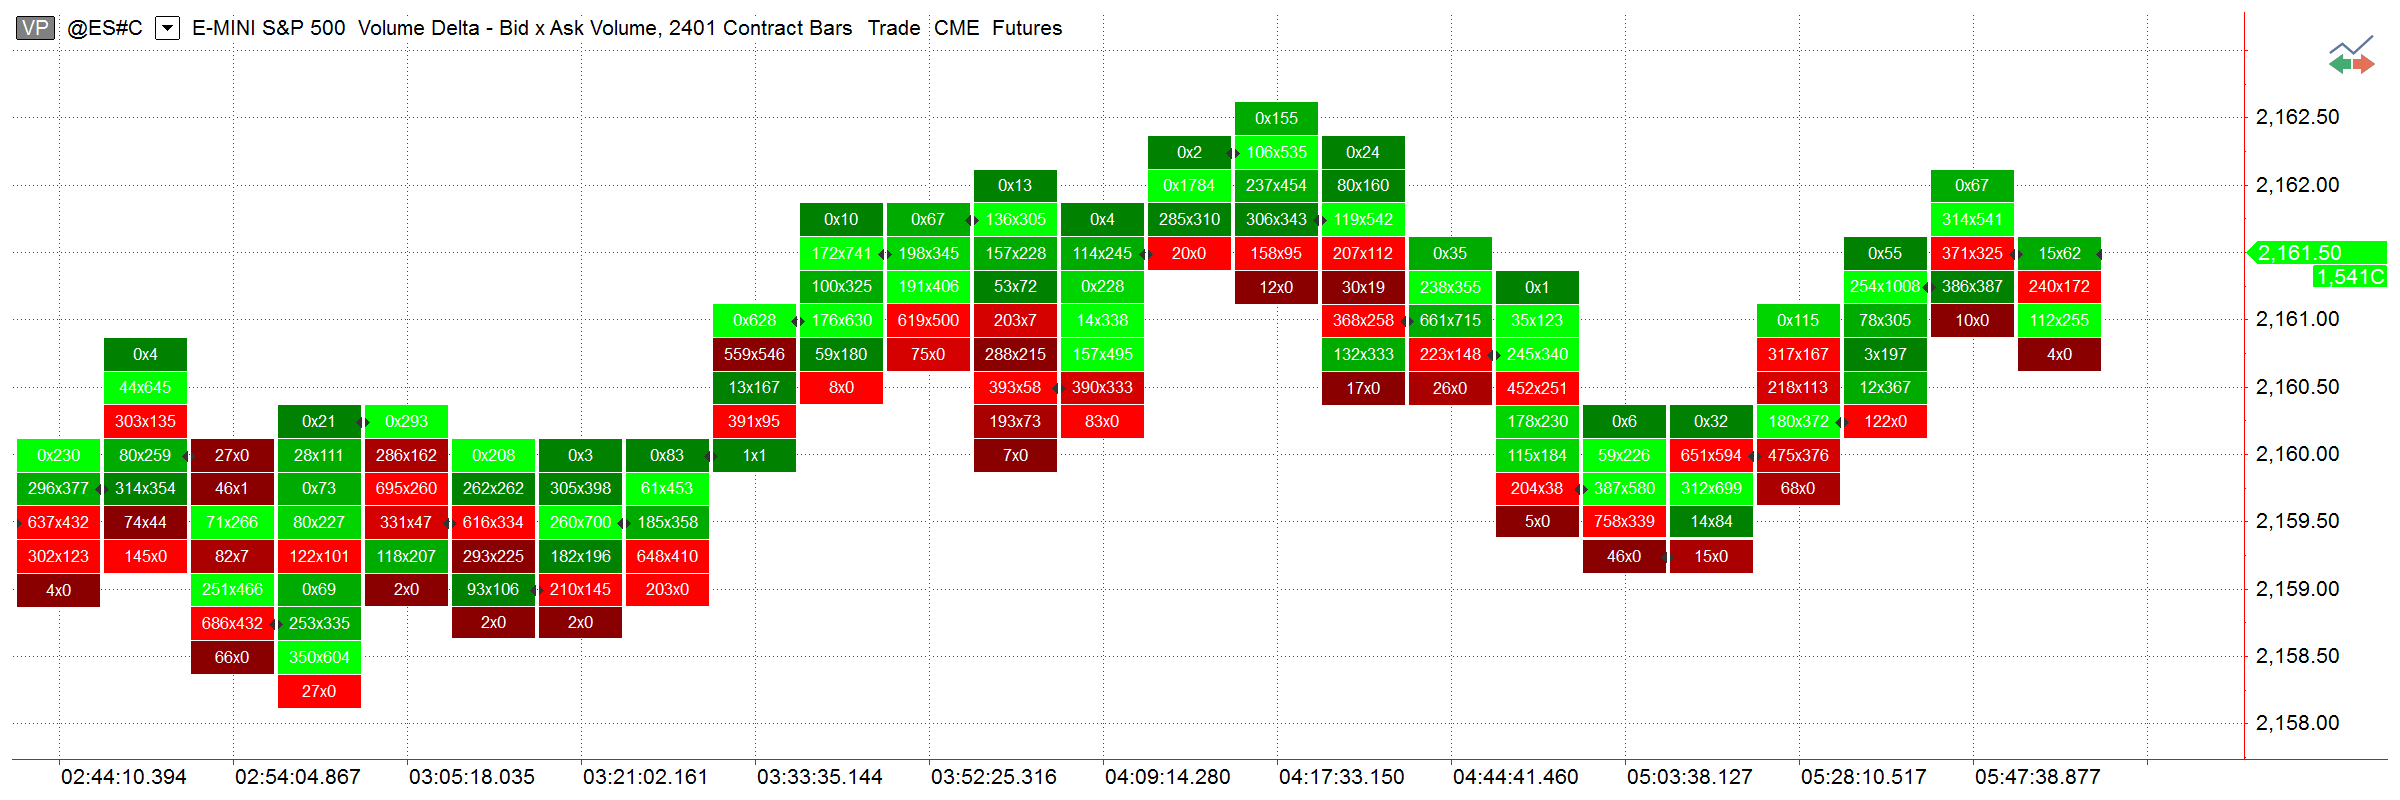
Volume Delta
Volume Delta helps you keep track of trades that were completed on ask or bid prices in real-time. It plots a series of boxes with volume displayed inside them.
MultiCharts
Setting up Volume Breakdown
There are two methods available in MultiCharts that specify how to differentiate Buy and Sell volume on Volume Delta charts. You can choose either Ask Traded vs Bid Traded or Up Ticks vs Down Ticks option. Ask Traded vs Bid Traded method compares the current tick price with the current Ask or Bid tick price. Up and Down Ticks breakdown uses the comparison of the current and the previous tick price. Learn more details of this option in our article.
Arrange the volume data the way you want
Display option configures how volume is shown inside the box. One can set it up according to his or her requirements. There are three methods available for MultiCharts users: Bid x Ask Volume, Total Volume or Delta (Ask – Bid Volume).
Volume Delta and Profile histogram styles
Volume Delta is traditionally shown in rectangular boxes with the color fill gradient ranging between red and green, depending on the volume values. Profile style (available when volume is shown as Delta) transforms the boxes into a histogram for easier perception of most active price levels.
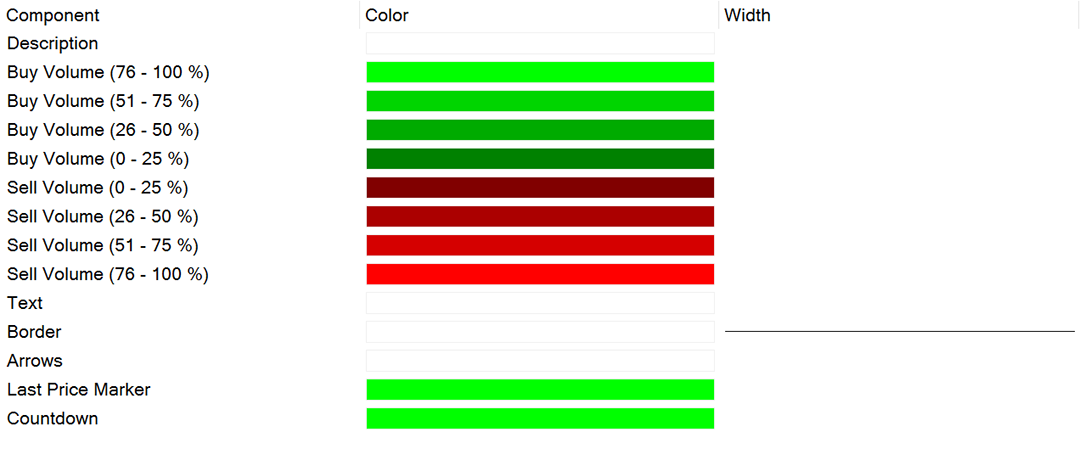
Customize Colors, Sizes and Styles of the components
You can display a volume profile on a per-bar basis, for the session, or for the entire week – all depending on what you are trying to see. Note: when your chart is set to “1 week” or higher resolution, you can only use per-bar setting.
Volume Delta
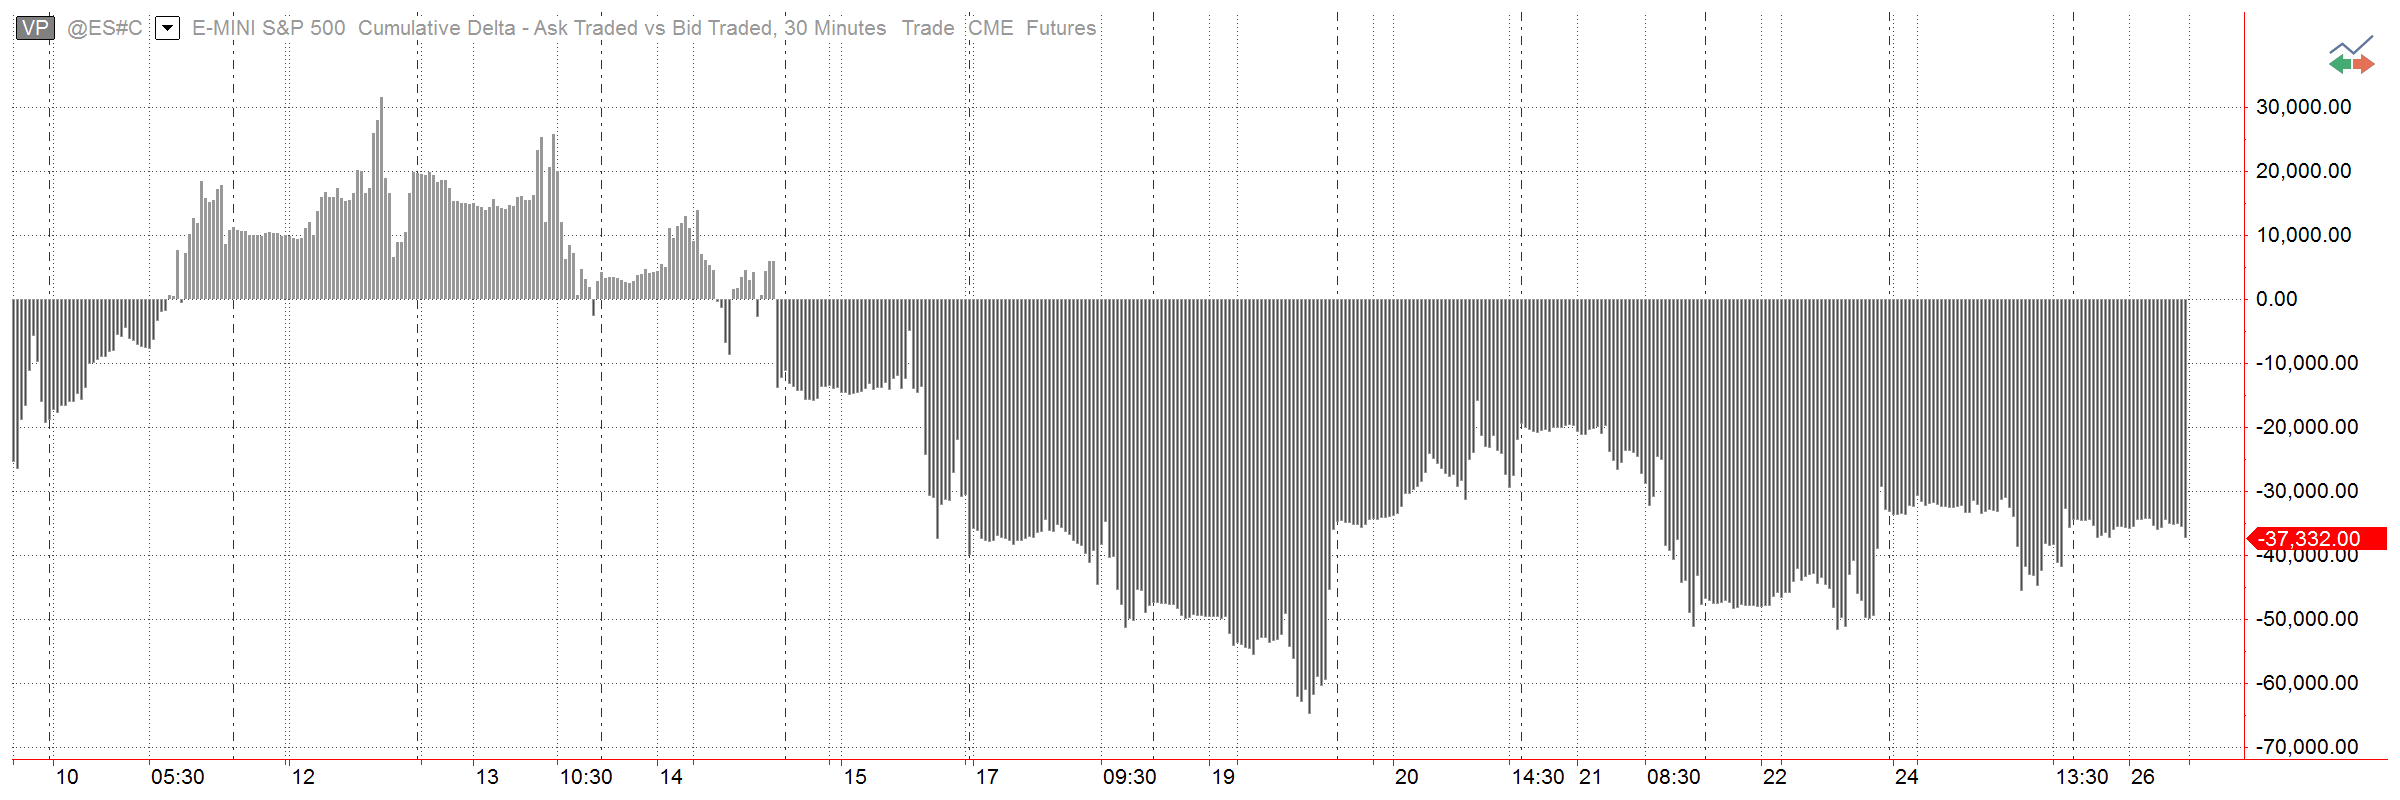
Cumulative Delta
Knowing if there are more buyers or sellers at particular price can be an important indication of where the market is going. Cumulative delta plots the difference between asks and bids to give you that info.
MultiCharts
Customize Cumulative Delta charts
You can change to your liking the color, size and style of any component. For complete information about our Cumulative Delta, read our Cumulative Delta article.
Histogram Style
Cumulative Delta charts use time for the X-axis and its own scale for the Y-axis. The histogram is a convenient way of visualizing how far from the central zero line the delta deviated.
Volume Breakdown
There are two methods available in MultiCharts that specify how to differentiate Buy and Sell volume on Cumulative Delta charts. You can choose either Ask Traded vs Bid Traded or Up Ticks vs Down Ticks option. Ask Traded vs Bid Traded method compares the current tick price with the current Ask or Bid tick price. Up and Down Ticks breakdown uses the comparison of the current and the previous tick price. Learn more details of this option in this article.
Time Price Opportunity (TPO)
TPO is a flexible tool that analyzes the amount of trading activity for each level the market traded at, which makes it a great solution for determining where the most trading is occurring at any given time. Find technical details in this article.
MultiCharts
.png)
15 Pre-Built Volume Indicators
MultiCharts has 15 indicators included to help visualize volume in different ways. TimePriceOpportunity is of special interest when working with 2 data series.