MultiCharts 9.0 Beta 1 is a big step forward for our platform. We added a huge feature - real-time portfolio trading through all available brokers!
In this version we also concentrated on dramatically improving individual and portfolio backtesting, making it the most accurate version ever. We added new functionality of a second pass when calculating the portfolio, which opens possibilities like rotational trading, pair trading and other interesting implementations. Portfolio Trader now also has walk-forward optimization and custom fitness function.
Learn more here
Download MultiCharts 9.0 Beta 1
Portfolio Trader Manual
Portfolio Trader Strategy Examples
MULTICHARTS 9.0 BETA 1
-
Smoky

- Posts: 526
- Joined: Dec 03 2010
- Location: Thailand
- Has thanked: 99 times
- Been thanked: 125 times
many thanks for this new release 
what a wonderful work !
for me the biggest difference is the speed of loading workspaces, new features for auto-trader, and finally optimized cpu usage ! (there is still work in this direction see picture ) with tree charts opened i will prefer to see 3 cores in 100% usage with very big working stategy in tick/tick on each charts
love :
"Added a new option "Use the actual position at the broker”"
To run again after disconnection
"Added a registry key for disabling the logs packing in archives when their size reaches 100 MB"
For SSD space and cpu usage to write them Yes !
"An option added to LMAX broker profile/data feed configuration to switch usage of heartbeats for connection loss detection."
I use it, but how does it work ?
Added new indication of DataServer Mode to the status line of the main MultiCharts window.
First step to control losing connection from stategy code
MC team is on good way, congratulations
what a wonderful work !
for me the biggest difference is the speed of loading workspaces, new features for auto-trader, and finally optimized cpu usage ! (there is still work in this direction see picture ) with tree charts opened i will prefer to see 3 cores in 100% usage
love :
"Added a new option "Use the actual position at the broker”"
To run again after disconnection
"Added a registry key for disabling the logs packing in archives when their size reaches 100 MB"
For SSD space and cpu usage to write them Yes !
"An option added to LMAX broker profile/data feed configuration to switch usage of heartbeats for connection loss detection."
I use it, but how does it work ?
Added new indication of DataServer Mode to the status line of the main MultiCharts window.
First step to control losing connection from stategy code
MC team is on good way, congratulations
-
sptrader

- Posts: 742
- Joined: Apr 09 2010
- Location: Texas
- Has thanked: 483 times
- Been thanked: 274 times
- Contact:
*********************************************************************Due to problems plotting indicators and failure to connect to chart trading with Ib for v9 I need to go back to 8.8.
Would this just be a case of re-installing 8.8
* You need to run V9 beta1 again and during the install process, it will give you the option of removing it..then you can install ver 8.8 ..
-
Dave Masalov

- Posts: 1712
- Joined: Apr 16 2010
- Has thanked: 51 times
- Been thanked: 490 times
Hello jl12,Due to problems plotting indicators and failure to connect to chart trading with Ib for v9 I need to go back to 8.8.
Would this just be a case of re-installing 8.8
Could you be more precise? Were you able to connect IB broker profile in MC 9.0 Beta1? Did you see any error messages in Order and Position Tracker? Please desribe the issue in details.
To downgrade MultiCharts you should uninstall the latest version from Windows Control Panel --> Add/Remove Programs and then install the previous version.
You may want to backup your data: https://www.multicharts.com/trading-sof ... _User_Data

MC team, you have done a great job on this beta, on my end the memory consumption of MultiCharts64.exe has been substantially reduced from about 7-8 GB to around 5.5 GB.
I also recognized the optimized CPU usage which seems to make better use of all cores.
However, I am not too sure if the following change is really an improvement:
I also recognized the optimized CPU usage which seems to make better use of all cores.
However, I am not too sure if the following change is really an improvement:
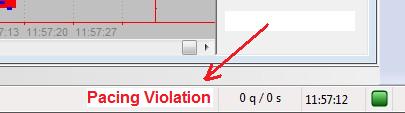
As I cannot avoid to get multiple IB pacing violations as soon as I download some tick data for some of my instruments, it would definitely be preferable to have an option to deactivate those pop-ups.Now Pacing Violation alert (when too much data is requested from IB) pops up in MultiCharts and this violation is more noticeable to users
- Attachments
-
- pacing_violations.jpg
- (94.08 KiB) Downloaded 6937 times
-
tcat
- Posts: 176
- Joined: Feb 02 2008
- Location: Lausanne, Switzerland
- Has thanked: 9 times
- Been thanked: 5 times
Hello,
Here is my feedback so far on the latest 9.0 beta.
1) 5 of my indicators would no longer compile after the installation. Upon investigation, I had to change the names for variables such as USD, EUR, CAD,... Still, I don't understand why, as I do not deal with fxcm.
2) Scaling issue: In subcharts where the instrument appears to be after an indicator (as a result of a drag and drop), scaling of the chart gets screwed (flatten) after a while. I solved the issue by reordering the indicators after the data. The issue did not appear at first, but after a while I found sub-charts being flatten.
3) Data Window font size. I can't find a way to reduce the font size of the data window.
4) Missing:
a) The "Help" link to "MC wiki" should be defined in the Powerlanguage Editor...
b) Update to MC should occur from MC without the need to re-enter your ID.
c) Sub-charts (and even charts) should be lockable in size. I use sub-charts for which the height should be fixed once and for all.
Otherwise, I am waiting for updates regarding LMAX issues and the new backtesting engine (coming with 9.1).
Cheers,
Thierry
I will not upgrade till there is an option to disable these Pacing Violation pop-ups. I have 40 charts and when starting MC they always hit the IB pacing violation data limit.
Please add the disable option as suggested below!
PS in general, MC is a great product. I understand each new feature leads to more complication. But please realise that some people don't necessarily want new features if the old behaviour works fine (as in this case for me)
Please add the disable option as suggested below!
PS in general, MC is a great product. I understand each new feature leads to more complication. But please realise that some people don't necessarily want new features if the old behaviour works fine (as in this case for me)
MC team, you have done a great job on this beta, on my end the memory consumption of MultiCharts64.exe has been substantially reduced from about 7-8 GB to around 5.5 GB.
...
However, I am not too sure if the following change is really an improvement:As I cannot avoid to get multiple IB pacing violations as soon as I download some tick data for some of my instruments, it would definitely be preferable to have an option to deactivate those pop-ups.Now Pacing Violation alert (when too much data is requested from IB) pops up in MultiCharts and this violation is more noticeable to users
At least they should disappear after a few seconds.I will not upgrade till there is an option to disable these Pacing Violation pop-ups. I have 40 charts and when starting MC they always hit the IB pacing violation data limit.
Please add the disable option as suggested below!
The new Multicharts 9.0 beta is amazing especially for automated traders. I'm most excited about portfolio trading and portfolio walk forward analysis!
Are there any plans to allow CommandLine to work with Portfolio Trader soon? I need the ability to programmatically load and change symbols.
It seems to take a longer time for the Portfolio Trader to load all the necessary historical data compared to just opening a workspace with charts.
It would be great if you can specify the amount of data for each individual instrument instead of having one setting for every instrument. Some of my trading strategies need more historical data than other strategies. I would like to conserve as much processing power and memory as possible.
Finally, when can we expect the release version?
-
JoshM

- Posts: 2196
- Joined: May 20 2011
- Location: The Netherlands
- Has thanked: 1544 times
- Been thanked: 1565 times
- Contact:
As I cannot avoid to get multiple IB pacing violations as soon as I download some tick data for some of my instruments, it would definitely be preferable to have an option to deactivate those pop-ups.
Wow, that's so annoying. Thanks for reporting it; this is something I'll consider when updating MC on my IB pc.I will not upgrade till there is an option to disable these Pacing Violation pop-ups. I have 40 charts and when starting MC they always hit the IB pacing violation data limit.
Please add the disable option as suggested below!
But certainly don't stack them like is done in Seneca's screenshot. What's the point in repeating the same error box over and over again? I suspect that for all of us our memory isn't that bad.At least they should disappear after a few seconds.
-
TJ

- Posts: 7775
- Joined: Aug 29 2006
- Location: Global Citizen
- Has thanked: 1036 times
- Been thanked: 2233 times
I would suggest MC can place the message here:
- Attachments
-
- Pacing Violation.jpg
- (8.83 KiB) Downloaded 8312 times
Great idea, TJ. I would suggest that all alerts be placed there instead of in popups. Maybe a red ALERT, ERROR, or a description as TJ has pointed out. Once it appears we would be able to click on it and see what's wrong.
Or maybe limit the alert bubble to one bubble per issue type at any given time which seems like the quick fix?
Or maybe limit the alert bubble to one bubble per issue type at any given time which seems like the quick fix?
-
shanemcdonald
- Posts: 196
- Joined: Aug 08 2012
- Has thanked: 41 times
- Been thanked: 41 times
When you backtest strategies in the portfolio trader, can you set the data to 1 tick like you can on a chart under strategy properties ?
This provides great accuracy when backtesting a strategy on a chart. I would hope you can do this in portfolio trader as well.
shane
This provides great accuracy when backtesting a strategy on a chart. I would hope you can do this in portfolio trader as well.
shane
-
Henry MultiСharts

- Posts: 9165
- Joined: Aug 25 2011
- Has thanked: 1264 times
- Been thanked: 2958 times
However, I am not too sure if the following change is really an improvement:As I cannot avoid to get multiple IB pacing violations as soon as I download some tick data for some of my instruments, it would definitely be preferable to have an option to deactivate those pop-ups.Now Pacing Violation alert (when too much data is requested from IB) pops up in MultiCharts and this violation is more noticeable to users
I will not upgrade till there is an option to disable these Pacing Violation pop-ups. I have 40 charts and when starting MC they always hit the IB pacing violation data limit. Please add the disable option as suggested below!
At least they should disappear after a few seconds.
Wow, that's so annoying. Thanks for reporting it; this is something I'll consider when updating MC on my IB pc.But certainly don't stack them like is done in Seneca's screenshot. What's the point in repeating the same error box over and over again? I suspect that for all of us our memory isn't that bad.At least they should disappear after a few seconds.
MC Team - please remove pacing violations pop-ups. We don't need that. Its annoying and cumbersome. Thanks.
I would suggest MC can place the message here:
Dear users,Great idea, TJ. I would suggest that all alerts be placed there instead of in popups. Maybe a red ALERT, ERROR, or a description as TJ has pointed out. Once it appears we would be able to click on it and see what's wrong. Or maybe limit the alert bubble to one bubble per issue type at any given time which seems like the quick fix?
Thank you for your feedback. We will add an option in IB data provider configuration window to disable the "Pacing Violation" pop-up in MultiCharts 9.0 Beta 2.
-
Henry MultiСharts
- Posts: 9165
- Joined: Aug 25 2011
- Has thanked: 1264 times
- Been thanked: 2958 times
jl12, do you run PowerLanguage Editor as administrator? If you run one component of MultiCharts as administrator, then you need to run all other MultiCharts applications as administrator as well, in order to make them work properly.If I don't open Mc as Admin the indicators often don't plot.
Which data provider and broker do you use for this chart? Are you able to capture a video demonstrating it or come to our live chat to demonstrate it?Chart trading Bid Ask prices shown often freeze.
-
Henry MultiСharts
- Posts: 9165
- Joined: Aug 25 2011
- Has thanked: 1264 times
- Been thanked: 2958 times
Hello Thierry, thank you for your feedback.Hello,
Here is my feedback so far on the latest 9.0 beta.
1) 5 of my indicators would no longer compile after the installation. Upon investigation, I had to change the names for variables such as USD, EUR, CAD,... Still, I don't understand why, as I do not deal with fxcm.
Currency codes are now constants that are used to designate a certain currency. You can find the complete list in PowerLanguage editor->Navigator tab->Dictionary->Keyword reference->Currency codes.
Please attach a full sized screenshot demonstrating this behavior and a workspace for replicating it with prebuilt studies on our end.2) Scaling issue: In subcharts where the instrument appears to be after an indicator (as a result of a drag and drop), scaling of the chart gets screwed (flatten) after a while. I solved the issue by reordering the indicators after the data. The issue did not appear at first, but after a while I found sub-charts being flatten.
Data Window font size gets the font size of the Y-price scale. Please go to Format->Window->Y-price scale to configure it.3) Data Window font size. I can't find a way to reduce the font size of the data window.
The Keyword reference is already available in the editor window itself.4) Missing:
a) The "Help" link to "MC wiki" should be defined in the Powerlanguage Editor...
If a newer release version has been issued before you started MultiCharts then you will have a popup alert that a new release version is available for download. You can also go to Help tab to "Check for updates" to get more details on the version and get the direct download link for your version.b) Update to MC should occur from MC without the need to re-enter your ID.
If you were running MultiCharts when a newer version became available-you will receive the info if you restart MultiCharts (and wait until tsserver.exe process ends in Task Manager).
Please follow us on Twitter, Facebook, LinkedIn, and our Traders’ Blog to get the latest updates and beta announcements.
Are you referring to the chart size or to the user defined scaling of the window?c) Sub-charts (and even charts) should be lockable in size. I use sub-charts for which the height should be fixed once and for all.
-
Henry MultiСharts
- Posts: 9165
- Joined: Aug 25 2011
- Has thanked: 1264 times
- Been thanked: 2958 times
This is not something that is in our "to-do" list at the moment. You may want to submit a feature request to the Project Management of our web site so other users can vote for it: https://www.multicharts.com/pm/Hello quantarb, thank you for your feedback.
Are there any plans to allow CommandLine to work with Portfolio Trader soon? I need the ability to programmatically load and change symbols.
There should not be any difference in the data loading speed. If you are able to replicate this behavior - please come to our live chat Monday-Friday 6:30 am - 3 pm EST to demonstrate it remotely.It seems to take a longer time for the Portfolio Trader to load all the necessary historical data compared to just opening a workspace with charts.
That is not technically possible. Please see "Script Calculation and Raw Order Generation" in Portfolio Trader Manual for more information.It would be great if you can specify the amount of data for each individual instrument instead of having one setting for every instrument. Some of my trading strategies need more historical data than other strategies. I would like to conserve as much processing power and memory as possible.
There is no exact release date yet, as the beta testing has just started. Release version can be expected by the end of the summer.Finally, when can we expect the release version?
-
Henry MultiСharts
- Posts: 9165
- Joined: Aug 25 2011
- Has thanked: 1264 times
- Been thanked: 2958 times
Hello Shane,When you backtest strategies in the portfolio trader, can you set the data to 1 tick like you can on a chart under strategy properties ? This provides great accuracy when backtesting a strategy on a chart. I would hope you can do this in portfolio trader as well.
Bar Magnifier is not currently available in Portfolio Trader. You can vote for this functionality in our project management section here: MC-787
In Portfolio Trader
in Strategy Analysis \ Performance ratios
there only show Portfolio Net Profit as % of Max Portfolio Drawdown ,
while in break down by symbols
we still get all the performance ratios
as usually get in backtesting of one symbol chart.
Why cannot we have the same set of ratios
so as to see the performance of the portfolio ?
-
Henry MultiСharts
- Posts: 9165
- Joined: Aug 25 2011
- Has thanked: 1264 times
- Been thanked: 2958 times
Hello Meecc,In Portfolio Trader
in Strategy Analysis \ Performance ratios
there only show Portfolio Net Profit as % of Max Portfolio Drawdown ,
while in break down by symbols
we still get all the performance ratios
as usually get in backtesting of one symbol chart.
Why cannot we have the same set of ratios
so as to see the performance of the portfolio ?
Portfolio consists of different symbols with different price levels and the strategy can be long on one symbol and short on the other at the same time. Therefore, it is not feasible to calculate some ratios. You can find them in Breakdown by Symbols section of Portfolio Performance Report.
It seems that user need to imagine for the as-a-whole portfolio performance ratios.
May be adding a line of the portfolio level as a bottom line,
where it is possible to calculate,
to each subpage of Break Down by Symbols section :
Overview ; Ratios ; Equity Curve Analysis ,
may make it easier
to view as-a-whole portfolio figures in comparison to symbol-wise figures.
for your consideration :
-
arnie

- Posts: 1594
- Joined: Feb 11 2009
- Location: Portugal
- Has thanked: 481 times
- Been thanked: 514 times
Has there been "backstage" discussions regarding playback volume profile/footprint data?
It's really hard playback the day and not having the volume profile available.
Playback allows you to... review the trading day, correct?
In my case, I use profile intensely, I'm always following the HVN's and LVN's for each 30min period has also the entire day against previous day's, trying to assess who's in control, how prices react at each HVN/LVN...
When playback the day without having the profile information it's the same as watching a movie without sound. Sure you can see the story developing but you get no feeling, no context or at least you can only see half the context, price.
You can be watching Heath Ledger performing the Joker character in Batman but you'll never be able to get the full impact of his performance, of his genius if you can't hear him speak, if you can't hear the music and the background noises.
This is how the playback tool looks now, it's only able to give you half the story, price. The other half, volume, if want it, you need to imagine it.
Sure, you can record your screen for later review but you'll find out that rarely you've recorded that particular time that you wanted to review and also you'll find how stressful it is not being able to resize the chart or to add/remove a study since you're watching a recording.
-
shanemcdonald
- Posts: 196
- Joined: Aug 08 2012
- Has thanked: 41 times
- Been thanked: 41 times
Does the portfolio trader use live tick data during forward testing with autotrade turned on ?Hello Shane,When you backtest strategies in the portfolio trader, can you set the data to 1 tick like you can on a chart under strategy properties ? This provides great accuracy when backtesting a strategy on a chart. I would hope you can do this in portfolio trader as well.
Bar Magnifier is not currently available in Portfolio Trader. You can vote for this functionality in our project management section here: MC-787
I have some strategies on charts that don't match the same strategies in portfolio trader after this weeks testing.
I am not sure why they would have different results.
shane
-
Henry MultiСharts
- Posts: 9165
- Joined: Aug 25 2011
- Has thanked: 1264 times
- Been thanked: 2958 times
Meecc, thank you for your suggestion. You may want to submit a feature request to the Project Management of our web site so other users can vote for it: https://www.multicharts.com/pm/It seems that user need to imagine for the as-a-whole portfolio performance ratios.
May be adding a line of the portfolio level as a bottom line,
where it is possible to calculate,
to each subpage of Break Down by Symbols section :
Overview ; Ratios ; Equity Curve Analysis ,
may make it easier
to view as-a-whole portfolio figures in comparison to symbol-wise figures.
for your consideration :
All feature requests are forwarded to the management of the company and are evaluated in a timely manner. Please note that even though we value your opinion not all requests can be implemented due to the fact that some features do not fit into our current roadmap.
-
Henry MultiСharts
- Posts: 9165
- Joined: Aug 25 2011
- Has thanked: 1264 times
- Been thanked: 2958 times
arnie, this is not something that is in our "to-do" list at the moment. You can vote for it here.Has there been "backstage" discussions regarding playback volume profile/footprint data?
-
Henry MultiСharts
- Posts: 9165
- Joined: Aug 25 2011
- Has thanked: 1264 times
- Been thanked: 2958 times
Portfolio Trader does not support IntraBar Order Generation. Please make sure all of the settings are the same in MultiCharts and in Portfolio Trader.Does the portfolio trader use live tick data during forward testing with autotrade turned on ?
I have some strategies on charts that don't match the same strategies in portfolio trader after this weeks testing.
I am not sure why they would have different results.
shane
Any chance that this will get supported in future?Portfolio Trader does not support IntraBar Order Generation. Please make sure all of the settings are the same in MultiCharts and in Portfolio Trader.Does the portfolio trader use live tick data during forward testing with autotrade turned on ?
I have some strategies on charts that don't match the same strategies in portfolio trader after this weeks testing.
I am not sure why they would have different results.
shane
-
Henry MultiСharts
- Posts: 9165
- Joined: Aug 25 2011
- Has thanked: 1264 times
- Been thanked: 2958 times
hilbert, unfortunately that is not technically possible at the moment and that is less likely it will be changed in the nearest future.Any chance that this will get supported in future?
-
ABC

- Posts: 733
- Joined: Dec 16 2006
- Location: www.abctradinggroup.com
- Has thanked: 126 times
- Been thanked: 415 times
- Contact:
I noticed a couple of minor graphical and format issues.
On tick or volume charts the grid lines are sometimes cluttered. I have not not oticed this in 8.8:
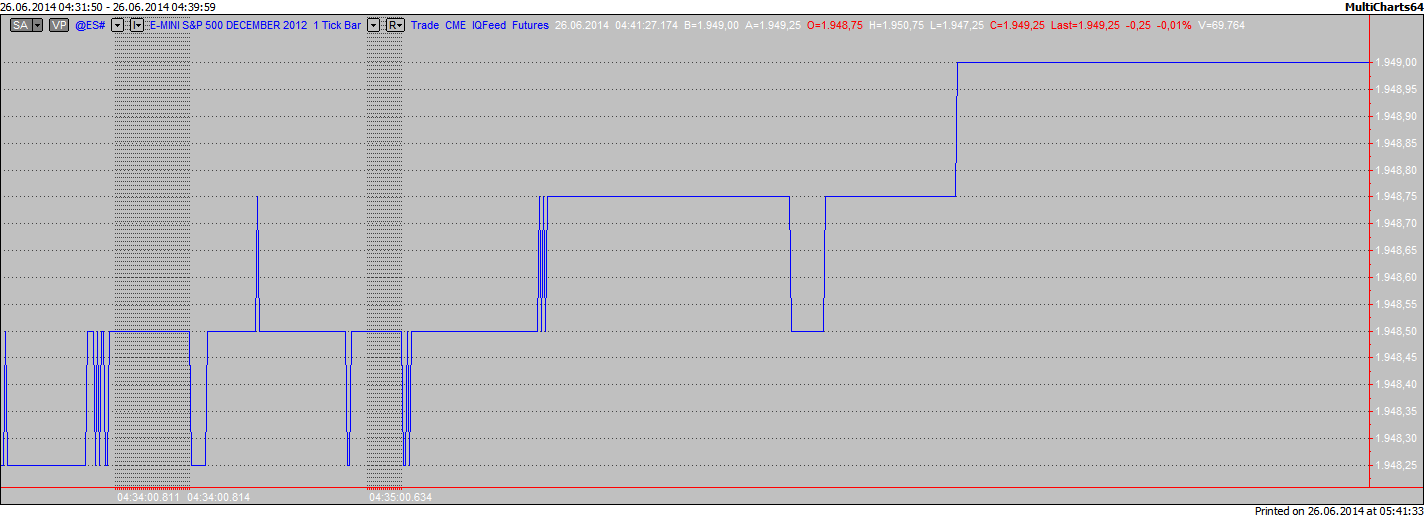
The default color for the Volume bars seems to have changed. Some prices are white with white text color now. I am not sure if this is intended or only on my end. I know this can be changed easily, but you might spare yourself some support requests from new users:
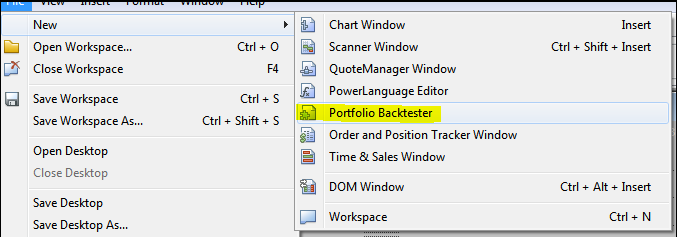
Via File -> New it still says "Portfolio Backtester" where it probably should read "Portfolio Trader".
Again, all those are minor things, I just wanted to bring them to attention.
Regards,
ABC
On tick or volume charts the grid lines are sometimes cluttered. I have not not oticed this in 8.8:
The default color for the Volume bars seems to have changed. Some prices are white with white text color now. I am not sure if this is intended or only on my end. I know this can be changed easily, but you might spare yourself some support requests from new users:
Via File -> New it still says "Portfolio Backtester" where it probably should read "Portfolio Trader".
Again, all those are minor things, I just wanted to bring them to attention.
Regards,
ABC
- Attachments
-
- Backtester.png
- (23.17 KiB) Downloaded 7736 times
-
- VolumBars.PNG
- (17.8 KiB) Downloaded 7726 times
-
- Grid Lines.png
- (26.05 KiB) Downloaded 7740 times
-
Henry MultiСharts
- Posts: 9165
- Joined: Aug 25 2011
- Has thanked: 1264 times
- Been thanked: 2958 times
Hello ABC,I noticed a couple of minor graphical and format issues.
On tick or volume charts the grid lines are sometimes cluttered. I have not not oticed this in 8.8:
The default color for the Volume bars seems to have changed. Some prices are white with white text color now. I am not sure if this is intended or only on my end. I know this can be changed easily, but you might spare yourself some support requests from new users:
Via File -> New it still says "Portfolio Backtester" where it probably should read "Portfolio Trader".
Thank you for reporting.
1) This issue has been already resolved in MultiCharts 9.0 Beta 1
2) This issue has been confirmed. The fix is targeted to MultiCharts 9.0 Beta 2.
3) Please make sure you are running the public builds of MC 9.0 beta 1 9346/9345 that already have this addressed.
-
Henry MultiСharts
- Posts: 9165
- Joined: Aug 25 2011
- Has thanked: 1264 times
- Been thanked: 2958 times
Hello ADG88,Can I have daily charts "build from minutes" in MC9 Portfolio Trader?
That is not possible at the moment.
-
Yves BENOIT
- Posts: 30
- Joined: Jul 17 2009
- Has thanked: 5 times
- Been thanked: 10 times
1) If you want to resize any window , I found sizer.exeHello,
Here is my feedback so far on the latest 9.0 beta.
c) Sub-charts (and even charts) should be lockable in size. I use sub-charts for which the height should be fixed once and for all.
http://www.brianapps.net/sizer/
very useful (to fit external size of a window, to a video projector resolution, for instance)
2) I suppose Tcat wants like others to lock sub chart height:
imagine a chart with 1 instrument and 2 indicators (3 sub charts).
I manually set:
instrument sub1 height= 8cm, indicatorA sub2 height=5cm, indicatorB sub3= 2cm.
If I set IndicatorA Status off, then :
instrument sub1 height= 11cm, , indicatorB sub2= 4cm.
If I reset IndicatorA Status on, then:
instrument sub1 height= 9cm, indicatorA sub2 height=3cm, indicatorB sub3= 3cm.
This example comes from a real difficulty to make a live demonstration to audience: Audience get lost when price scale changes so much. I do too.
Problem is worse when you have 10 indicators and you want to remove 1 ,and then add a new one: you have to manually rescale every sub chart.
My comments so far.
1. It does seem quicker and less cpu intensive so thanks for that. I also appreciate the changes made to volume delta, and the right click option to remove visible drawings - a great time saver.
2. My problems are in the scanner area.
a) where I have in my pla coded RGB values for color inputs this is causing problems for the scanner - eg if I have a value RGB(32,45,46) when it comes across to the scanner the input just shows 32 and the rest of the input has disappeared. Even if I then correct it manually via the input I will have the same problem when I next start the scanner. Since some of my scanner code is based on different colors this is rather frustrating
b) I have some indicators where I simply cannot remove individual plots no matter how hard I try. This was never an issue in previous versions of Multicharts with the same indicators. For example, I have a Renko scanner indicator bought from "CodeForTraders" (who are listed in your vendor area) that has about 15 plots. It was always intended that a user simply remove the ones that he did not wish to see in the scanner. Since I only want to see about four of the plots this problem renders the indicator unusable at present in MC 9.0 beta 1 as fifteen plots takes up most of the entire scanner window
Any ideas when we will see beta 2 and if there are any other related scanner bugs ?
Finally, any likelihood of real simulated trading via the bar replay in the near future ? I have created my own indicator to read manually placed arrows as orders just so I can make do for the time being.
Thanks
-
Henry MultiСharts
- Posts: 9165
- Joined: Aug 25 2011
- Has thanked: 1264 times
- Been thanked: 2958 times
Hello ADG88,How can I set "symbol mapping" in PortfolioTrader? Does it refer to the one in Multicharts?Thanks
That is correct. There is a single "Symbol Mapping" place - in MultiCharts.
-
tcat
- Posts: 176
- Joined: Feb 02 2008
- Location: Lausanne, Switzerland
- Has thanked: 9 times
- Been thanked: 5 times
Hi,
I am encountering two additional issues that did not exist before:
1) The reset "scales button" wrongly reset an indicator scale. The indicator scale is set to instrument per default, clicking the "reset scales" reset the scaling to "screen". Note that the instrument is in the front and the indicator in the back. It looks like the scale reset is applied to the first indicator or instrument in the sequence.
2) I am applying an indicator with: Text_new(D,T,C, Text(" "));
Instead of having the alignement based on current close, the alignement is now done on the last bar close. Behaviour under 8.xx was accurate though.
Thierry
-
Henry MultiСharts
- Posts: 9165
- Joined: Aug 25 2011
- Has thanked: 1264 times
- Been thanked: 2958 times
Hello Yves,2) I suppose Tcat wants like others to lock sub chart height:
imagine a chart with 1 instrument and 2 indicators (3 sub charts).
I manually set:
instrument sub1 height= 8cm, indicatorA sub2 height=5cm, indicatorB sub3= 2cm.
If I set IndicatorA Status off, then :
instrument sub1 height= 11cm, , indicatorB sub2= 4cm.
If I reset IndicatorA Status on, then:
instrument sub1 height= 9cm, indicatorA sub2 height=3cm, indicatorB sub3= 3cm.
This example comes from a real difficulty to make a live demonstration to audience: Audience get lost when price scale changes so much. I do too.
Problem is worse when you have 10 indicators and you want to remove 1 ,and then add a new one: you have to manually rescale every sub chart.
We were unable to replicate this behavior in our environment, the subcharts' height is locked and remain unchanged if we switch off/on the study. Please attach a full sized screenshot demonstrating this behavior (it would be best if you capture a video or come to our live chat to demonstrate it) and a workspace for replicating it with prebuilt studies on our end.
If you want a subchart to remain on it's place when the indicator is switched off you may want to enable the option "Enable indicator status switch in a status line of a chart" in File->Preferences->Charting. You will need to re-open your workspace to make the option come into effect.
-
Henry MultiСharts
- Posts: 9165
- Joined: Aug 25 2011
- Has thanked: 1264 times
- Been thanked: 2958 times
Hello mobelby,2. My problems are in the scanner area.
a) where I have in my pla coded RGB values for color inputs this is causing problems for the scanner - eg if I have a value RGB(32,45,46) when it comes across to the scanner the input just shows 32 and the rest of the input has disappeared. Even if I then correct it manually via the input I will have the same problem when I next start the scanner. Since some of my scanner code is based on different colors this is rather frustrating
b) I have some indicators where I simply cannot remove individual plots no matter how hard I try. This was never an issue in previous versions of Multicharts with the same indicators. For example, I have a Renko scanner indicator bought from "CodeForTraders" (who are listed in your vendor area) that has about 15 plots. It was always intended that a user simply remove the ones that he did not wish to see in the scanner. Since I only want to see about four of the plots this problem renders the indicator unusable at present in MC 9.0 beta 1 as fifteen plots takes up most of the entire scanner window
Thank you for the reporting. Both of the issues have been confirmed and forwarded to our developers.
MultiCharts 9.0 beta 2 can be expected in 2 weeks. There are multiple data handling issues in beta 1 that will be addressed in beta 2.Any ideas when we will see beta 2 and if there are any other related scanner bugs ?
This functionality is not yet in our to-do list at the moment.Finally, any likelihood of real simulated trading via the bar replay in the near future ? I have created my own indicator to read manually placed arrows as orders just so I can make do for the time being.
-
Henry MultiСharts
- Posts: 9165
- Joined: Aug 25 2011
- Has thanked: 1264 times
- Been thanked: 2958 times
Hello Thierry,1) The reset "scales button" wrongly reset an indicator scale. The indicator scale is set to instrument per default, clicking the "reset scales" reset the scaling to "screen". Note that the instrument is in the front and the indicator in the back. It looks like the scale reset is applied to the first indicator or instrument in the sequence.
Only one price scale can be configured at a time when there are multiple instruments and/or studies on the same subchart. Please right click on the price scale, make sure the required instrument has a checkbox next to it.
Please go to Format->Study->Format your study->Properties->make sure "Update on every tick" is enabled.2) I am applying an indicator with: Text_new(D,T,C, Text(" "));
Instead of having the alignement based on current close, the alignement is now done on the last bar close. Behaviour under 8.xx was accurate though.
-
Henry MultiСharts
- Posts: 9165
- Joined: Aug 25 2011
- Has thanked: 1264 times
- Been thanked: 2958 times
This issue has been replicated and forwarded to our developers.Scaling issue: In subcharts where the instrument appears to be after an indicator (as a result of a drag and drop), scaling of the chart gets screwed (flatten) after a while. I solved the issue by reordering the indicators after the data. The issue did not appear at first, but after a while I found sub-charts being flatten.
-
tcat
- Posts: 176
- Joined: Feb 02 2008
- Location: Lausanne, Switzerland
- Has thanked: 9 times
- Been thanked: 5 times
It does, the issue results from the indicator being behind the instrument.Only one price scale can be configured at a time when there are multiple instruments and/or studies on the same subchart. Please right click on the price scale, make sure the required instrument has a checkbox next to it.
Formating of the indicator is correct, the issue is beta 9.0 related.Please go to Format->Study->Format your study->Properties->make sure "Update on every tick" is enabled.
I have also just experienced another flattening of the chart if you play with the scroll button of the mouse....and no way to reset the graph.
-
Henry MultiСharts
- Posts: 9165
- Joined: Aug 25 2011
- Has thanked: 1264 times
- Been thanked: 2958 times
It does not reset from "same as instrument" on our end. Please describe the exact steps for replicating the issue, capture a video, or come to our live chat to demonstrate this behavior.It does, the issue results from the indicator being behind the instrument.Only one price scale can be configured at a time when there are multiple instruments and/or studies on the same subchart. Please right click on the price scale, make sure the required instrument has a checkbox next to it.
We were unable to replicate it on our end. Please send the workspace and study for replicating this behavior to support@multicharts.com Attach a screenshot demonstrating the exact issue you have.Formating of the indicator is correct, the issue is beta 9.0 related.Please go to Format->Study->Format your study->Properties->make sure "Update on every tick" is enabled.
As I have mentioned in my previous post - it will be fixed in MultiCharts 9.0 beta 2.I have also just experienced another flattening of the chart if you play with the scroll button of the mouse....and no way to reset the graph.
-
PatrickSocal

- Posts: 58
- Joined: Apr 27 2013
- Location: San Diego, CA
- Has thanked: 23 times
- Been thanked: 30 times
Hi guys,
Thanks for this update. A lot of great new functionality is in this Beta. I've spent quite a bit of time with the Portfolio Trader and the new i_setplotvalue() functions, and I have the following bug reports and suggestions:
1) When I write a single-instrument strategy (not a MM strategy) and call the pmm_set_my_named_num() function, it works fine in the Portfolio Trader. But when I try to apply the strategy to a chart it throws an error. Standard workflow for portfolio strats is to develop them on a a single symbol in a chart before trying them on a portfolio with money management, so I consider this a bug rather than a feature.
2) When I call the i_setplotvalue() function from a single-instrument strategy and apply it to a chart it works fine (most of the time... see 3). But when I try to apply the same strategy in the Portfolio Trader it throws an error. Again, I see this as a bug rather than a feature.
3) When I create an indicator that calls i_getplotvalue() and I apply it to a chart it usually works. But when I recompile the companion strategy that calls the i_setplotvalue() function, the indicator often disappears. Toggling the indicator status to "off" and then "on" brings it back.
4) This is a feature request: The i_setplotvalue() and i_getplotvalue() functions are a nice workaround enabling us to plot from strategies. I love this ability, and I thank you for adding it. I would also like to be able to name the plot from the strategy rather than the indicator. Perhaps you could make an i_setplotname() and i_getplotname() function that takes a character string as its data argument.
Thanks for your consideration...
-
Henry MultiСharts
- Posts: 9165
- Joined: Aug 25 2011
- Has thanked: 1264 times
- Been thanked: 2958 times
Hello PatrickSocal,1) When I write a single-instrument strategy (not a MM strategy) and call the pmm_set_my_named_num() function, it works fine in the Portfolio Trader. But when I try to apply the strategy to a chart it throws an error. Standard workflow for portfolio strats is to develop them on a a single symbol in a chart before trying them on a portfolio with money management, so I consider this a bug rather than a feature.
Thank you for your feedback.
1) That is expected behavior. pmm* reserved words are designed for money management signals and can be used only in Portfolio Trader.
2) That is expected behavior. i_setplotvalue and i_getplotvalue allow sending information from a signal to an indicator that will do a plot on the chart. As there are no charts in Portfolio Trader - such reserved words are of no use there.2) When I call the i_setplotvalue() function from a single-instrument strategy and apply it to a chart it works fine (most of the time... see 3). But when I try to apply the same strategy in the Portfolio Trader it throws an error. Again, I see this as a bug rather than a feature.
There are multiple reserved words for setting the status in Portfolio Trader: pmms_strategies_set_status_for_all( stirng ), pmms_strategy_set_status(idx, str_val), pmm_set_my_status(str_val).
That is a known issue. It will be fixed in MultiCharts 9.0 beta 2.3) When I create an indicator that calls i_getplotvalue() and I apply it to a chart it usually works. But when I recompile the companion strategy that calls the i_setplotvalue() function, the indicator often disappears. Toggling the indicator status to "off" and then "on" brings it back.
Thank you for your suggestion. Unfortunately plot names cannot be changed dynamically. They are fixed upon the study compilation.4) This is a feature request: The i_setplotvalue() and i_getplotvalue() functions are a nice workaround enabling us to plot from strategies. I love this ability, and I thank you for adding it. I would also like to be able to name the plot from the strategy rather than the indicator. Perhaps you could make an i_setplotname() and i_getplotname() function that takes a character string as its data argument.
-
PatrickSocal
- Posts: 58
- Joined: Apr 27 2013
- Location: San Diego, CA
- Has thanked: 23 times
- Been thanked: 30 times
Hi Henry, thanks for the reply.Hello PatrickSocal,1) When I write a single-instrument strategy (not a MM strategy) and call the pmm_set_my_named_num() function, it works fine in the Portfolio Trader. But when I try to apply the strategy to a chart it throws an error. Standard workflow for portfolio strats is to develop them on a a single symbol in a chart before trying them on a portfolio with money management, so I consider this a bug rather than a feature.
Thank you for your feedback.
1) That is expected behavior. pmm* reserved words are designed for money management signals and can be used only in Portfolio Trader.
2) That is expected behavior. i_setplotvalue and i_getplotvalue allow sending information from a signal to an indicator that will do a plot on the chart. As there are no charts in Portfolio Trader - such reserved words are of no use there.2) When I call the i_setplotvalue() function from a single-instrument strategy and apply it to a chart it works fine (most of the time... see 3). But when I try to apply the same strategy in the Portfolio Trader it throws an error. Again, I see this as a bug rather than a feature.
May I point out a problem with these answers? It means that strategies using these keywords can either be run in a Chart or in the Portfolio Trader, but not both. And if you use both types of keyword, the strategy can't run in either application. This restricts our strat development workflow, and reduces productivity.
Yes of course there is no use for i_setplotvalue in the Portfolio Trader. But what if I want to develop a strategy in a chart window, see it and make sure it works as imagined, then run it on a portfolio of instruments? In that case, I want to have it applied in both applications, and toggle back and forth to make improvements. This *almost* works now. But in certain situations Portfolio Trader throws an error related to i_setplotvalue.
The other case is also interesting... Just because there is no use for a pmm* function in a chart, this doesn't mean the chart should throw an error. The chart should simply ignore it. Again, this enables a workflow in which the developer toggles back and forth between a Chart and the Portfolio Trader running the same strat, to test it, debug it, and make sure it's operating as expected.
Does this not sound reasonable?
-
arnie
- Posts: 1594
- Joined: Feb 11 2009
- Location: Portugal
- Has thanked: 481 times
- Been thanked: 514 times
I hope you guys really fix this because it's really annoying...We will add an option in IB data provider configuration window to disable the "Pacing Violation" pop-up in MultiCharts 9.0 Beta 2.
Every single day, when I open MC and TWS I receive this list of pop ups and from time to time they pop up during the session.
I don't think it's a good idea to remove completely the warning that the connection was lost. I like TJ's idea of placing the warnings near the clock.
And by the way, since version 8.7 or so I have no queue indication.
What happened?
- Attachments
-
- no queue.jpg
- (9.8 KiB) Downloaded 7543 times
-
- popup_ib.jpg
- (177.79 KiB) Downloaded 7491 times
-
Henry MultiСharts
- Posts: 9165
- Joined: Aug 25 2011
- Has thanked: 1264 times
- Been thanked: 2958 times
Most likely you have the popup generated by case 3 from your initial post, which will be resolved in beta 2.Yes of course there is no use for i_setplotvalue in the Portfolio Trader. But what if I want to develop a strategy in a chart window, see it and make sure it works as imagined, then run it on a portfolio of instruments? In that case, I want to have it applied in both applications, and toggle back and forth to make improvements. This *almost* works now. But in certain situations Portfolio Trader throws an error related to i_setplotvalue.
That is possible to check the id of the application calling the study with the help of getappinfo(aiApplicationType). Just restrict the chart from entering into the PMM part of the code and the issue will be resolved.The other case is also interesting... Just because there is no use for a pmm* function in a chart, this doesn't mean the chart should throw an error. The chart should simply ignore it. Again, this enables a workflow in which the developer toggles back and forth between a Chart and the Portfolio Trader running the same strat, to test it, debug it, and make sure it's operating as expected. Does this not sound reasonable?
-
Henry MultiСharts
- Posts: 9165
- Joined: Aug 25 2011
- Has thanked: 1264 times
- Been thanked: 2958 times
Hello arnie,I don't think it's a good idea to remove completely the warning that the connection was lost. I like TJ's idea of placing the warnings near the clock.
The option will affect the Pacing Violation messages only. The other connectivity alerts will remain on their place.
The queue indication shows up only when there is a queue. Until there is no queue - it is hidden.And by the way, since version 8.7 or so I have no queue indication.
What happened?
-
arnie
- Posts: 1594
- Joined: Feb 11 2009
- Location: Portugal
- Has thanked: 481 times
- Been thanked: 514 times
As you can see, there's 10 pop up warnings with the exact same time stamp regarding data farm connection.The option will affect the Pacing Violation messages only. The other connectivity alerts will remain on their place.
One pop up warning is enough, no reason to have 10.
It would be appreciated if you guys find a way to limit the pop up per warning and per time.
If in the same second the system triggers 10 warnings regarding the exact same thing, please only show one, no need to have all 10.
It's very annoying having all those pop up windows stacking in front of the charts.
EDIT:
Here we go again, a flood of pop up warnings at the exact same second.
Damn, my internet connection is really bad today
- Attachments
-
- conect.jpg
- (170.72 KiB) Downloaded 7479 times
Last edited by arnie on Jul 03 2014, edited 1 time in total.
I haven't loaded this Beta but I did read read through the list of changes. I was looking forward to having 'MC-879 - Easy to use multiple contract Targets and Stops' implemented as it says that it was targeted for this release in the PM.
However, I was unable to find any mention of it in the 'What's New' list. Can you let me know if it is in this Beta and, if not, when it will be added?
However, I was unable to find any mention of it in the 'What's New' list. Can you let me know if it is in this Beta and, if not, when it will be added?
-
Henry MultiСharts
- Posts: 9165
- Joined: Aug 25 2011
- Has thanked: 1264 times
- Been thanked: 2958 times
Hello Jad,I haven't loaded this Beta but I did read read through the list of changes. I was looking forward to having 'MC-879 - Easy to use multiple contract Targets and Stops' implemented as it says that it was targeted for this release in the PM.
However, I was unable to find any mention of it in the 'What's New' list. Can you let me know if it is in this Beta and, if not, when it will be added?
In the mentioned MC-879 it clearly says that "This issue is no longer targeted for MultiCharts 9.0 Beta 1."
The functionality you are looking for is targeted to MultiCharts 9.1 Beta 1. You can find the main PM entry here.
"clearly says" - Really?
In the mentioned MC-879 it clearly says that "This issue is no longer targeted for MultiCharts 9.0 Beta 1."
A strike-through of that line in the entry on Oct 02, thereby leaving the June 05 entry "This issue is targeted for MultiCharts 9.0 Beta 1." below it (... and still without a strike-through) - suggests to me that the Oct 02 decision was reversed at some point.
Certainly not anything like the clarity you seem to think it does. See attached
-
Henry MultiСharts
- Posts: 9165
- Joined: Aug 25 2011
- Has thanked: 1264 times
- Been thanked: 2958 times
In Project Management system the comments are aligned from bottom to the top."clearly says" - Really?
In the mentioned MC-879 it clearly says that "This issue is no longer targeted for MultiCharts 9.0 Beta 1."
A strike-through of that line in the entry on Oct 02, thereby leaving the June 05 entry "This issue is targeted for MultiCharts 9.0 Beta 1." below it (... and still without a strike-through) - suggests to me that the Oct 02 decision was reversed at some point.
Certainly not anything like the clarity you seem to think it does. See attached
The alignment is completely irrelevant.
The Line with the strike-through originally said:
"this issue is no longer targeted for Multicharts 9.0 Beta 1"
That strike through it implies that the decision (i.e. to no longer include it in the Beta) has been reversed and it will again be included in it. Even more so when the previous entry remained without a strike-through suggesting that it (the June 05 entry) is again in force.
If you wanted clarity, it is the Jun 05 entry that should have been struck-through and the Oct 02 entry left clear.
-
PatrickSocal
- Posts: 58
- Joined: Apr 27 2013
- Location: San Diego, CA
- Has thanked: 23 times
- Been thanked: 30 times
Thanks Henry, this seems like a reasonable workaround.That is possible to check the id of the application calling the study with the help of getappinfo(aiApplicationType). Just restrict the chart from entering into the PMM part of the code and the issue will be resolved.The other case is also interesting... Just because there is no use for a pmm* function in a chart, this doesn't mean the chart should throw an error. The chart should simply ignore it. Again, this enables a workflow in which the developer toggles back and forth between a Chart and the Portfolio Trader running the same strat, to test it, debug it, and make sure it's operating as expected. Does this not sound reasonable?
Volume Delta:
Improving the information on Volume Delta is great but you are missing the most important info: Comparing the number of contracts traded at the ASK versus the number of contracts traded at the BID rather than comparing volumes at the same price, See the link.
http://www.MD.com/blog/2013/07 ... imbalance/
This has PROVEN to be the correct way of looking at the order flow.
Can this be implemented in V9?
This is something I would like to see too. Allowing VP to be used with PnF would also be welcome.
Volume Delta:
Improving the information on Volume Delta is great but you are missing the most important info: Comparing the number of contracts traded at the ASK versus the number of contracts traded at the BID rather than comparing volumes at the same price, See the link.
http://www.MD.com/blog/2013/07 ... imbalance/
This has PROVEN to be the correct way of looking at the order flow.
Can this be implemented in V9?
Point Bar Size Error
With an interval of 6 Points the beta drew a Volume Delta bar of 7 Points. Also, when TEXT colour was changed from WHITE to BLACK the colour stayed WHITE.
Edit: I've just found the bar size issue exists in 8.8
With an interval of 6 Points the beta drew a Volume Delta bar of 7 Points. Also, when TEXT colour was changed from WHITE to BLACK the colour stayed WHITE.
Edit: I've just found the bar size issue exists in 8.8
-
arnie
- Posts: 1594
- Joined: Feb 11 2009
- Location: Portugal
- Has thanked: 481 times
- Been thanked: 514 times
MC calculates range bars differently so there's no problem there. Search the forum, there's a thread on the subjectPoint Bar Size Error
With an interval of 6 Points the beta drew a Volume Delta bar of 7 Points. Also, when TEXT colour was changed from WHITE to BLACK the colour stayed WHITE.
Edit: I've just found the bar size issue exists in 8.8
Regarding the volume delta text color, the image you posted we can't see any text so there's no way to see if the text is indeed white or black.
On my side there's no problem. Text is set to black and black it is.
For me it is a problem when a regular point (range) bar of 6 Points (ticks) has a Volume Delta bar that has an interval of 6 Points but draws the bar as 7 Points. Analysis is difficult looking at each tick and assigning bid and ask trades to it when the bars don't match. Different is OK as long as its consistent.
-
arnie
- Posts: 1594
- Joined: Feb 11 2009
- Location: Portugal
- Has thanked: 481 times
- Been thanked: 514 times
Volume Delta:
Improving the information on Volume Delta is great but you are missing the most important info: Comparing the number of contracts traded at the ASK versus the number of contracts traded at the BID rather than comparing volumes at the same price, See the link.
http://www.MD.com/blog/2013/07 ... imbalance/
This has PROVEN to be the correct way of looking at the order flow.
Can this be implemented in V9?
I can't understand the hype behind this Imbalance feature.
This is not the correct way to look at order flow, it's the only way to look at it.
When we look at the DOM we look at the offer and at the bid that is 1 tick below the offer. The same happens with footprint charts. When looking at the cumulative volume traded you are always comparing between the offer and the bid which is 1 tick below.
I don't understand why MD came up with the idea that this Imbalance reading is really how a footprint needs to be read when it has always been like that.
Having said that, one would think that read the cumulative volume traded at the bid and at the offer at the same price is wrong. Actually it's not. It's also a valid reading.
This Imbalance feature is just an algo that colors the text when the cumulative traded volume surpasses some percentage selected by the trader, nothing else.
Please don't misunderstand me, I think it's a valid feature to add to Multicharts volume delta bars. I'm just talking regarding MD's presentation of this feature. It sounds like they discover something new, making people really enthusiastic about it and it's really nothing more than a simple text highlight based on an user's input.
-
arnie
- Posts: 1594
- Joined: Feb 11 2009
- Location: Portugal
- Has thanked: 481 times
- Been thanked: 514 times
Have you compare a 6 point regular candle with a 6 point volume delta?For me it is a problem when a regular point (range) bar of 6 Points (ticks) has a Volume Delta bar that has an interval of 6 Points but draws the bar as 7 Points. Analysis is difficult looking at each tick and assigning bid and ask trades to it when the bars don't match. Different is OK as long as its consistent.
They have the exact same height.
There's no divergence there.
Thanks for your help Arnie. I appreciate you helping getting to the bottom of it.
When looking at the VD bar with the cursor it says the same height. However, looking at the actual high and low against the right margin gives slightly different information. The issue, however, is that if you have a 6 point VD bar and need to know what happens at every tick then you can't divide that 6 point bar into 7 bits as you can't reconcile what is happening at each price. I'm trying to see what trades on the bid and ask and these bids and asks can only be at even tick prices not a tick and a bit. I'm not seeing something that makes sense. I'd be glad to be corrected.
When looking at the VD bar with the cursor it says the same height. However, looking at the actual high and low against the right margin gives slightly different information. The issue, however, is that if you have a 6 point VD bar and need to know what happens at every tick then you can't divide that 6 point bar into 7 bits as you can't reconcile what is happening at each price. I'm trying to see what trades on the bid and ask and these bids and asks can only be at even tick prices not a tick and a bit. I'm not seeing something that makes sense. I'd be glad to be corrected.
-
arnie
- Posts: 1594
- Joined: Feb 11 2009
- Location: Portugal
- Has thanked: 481 times
- Been thanked: 514 times
It seems you have something off on your side.Thanks for your help Arnie. I appreciate you helping getting to the bottom of it.
When looking at the VD bar with the cursor it says the same height. However, looking at the actual high and low against the right margin gives slightly different information. The issue, however, is that if you have a 6 point VD bar and need to know what happens at every tick then you can't divide that 6 point bar into 7 bits as you can't reconcile what is happening at each price. I'm trying to see what trades on the bid and ask and these bids and asks can only be at even tick prices not a tick and a bit. I'm not seeing something that makes sense. I'd be glad to be corrected.
Volume delta bars and regular candle bars have the exact same high and low.
In red you have the high and low for each bar. There's no discrepancies there.
I did use a 5 point bar for my trading for a while but it started to be way too much information which ironically would make me lose track of the volume traded per price.
A 30min bar is way more telling...
Another bar type that I like to look at is reversal bars, specially a 5 or 6 tick reversal bar. Unfortunately MC does not have this bar type. It's already requested in PM.
Range, Tick, Volume, Reversal bars remove the time component from a chart which can facilitate the trend reading but time is such an important factor in human psychology that removing it from the markets make no sense to me, especially when trading discretionary based on order flow.
- Attachments
-
- hilo02.jpg
- (128.21 KiB) Downloaded 7418 times
-
- hilo01.jpg
- (242.19 KiB) Downloaded 7405 times
Thanks Arnie. I didn't understand what you meant by "different" but I now do. The other volume delta platform categorizes range bars as the number of PRICES in the range so a 5 tick range bar there has 5 prices and may have a high of 6 and a low of 2 while in MC a 5 tick or Point range bar is that the High minus the low is 5 so it would be a 6 high and a 1 low and has 6 PRICES in the bar.
I appreciate you setting me on the right path.
I appreciate you setting me on the right path.
-
Henry MultiСharts
- Posts: 9165
- Joined: Aug 25 2011
- Has thanked: 1264 times
- Been thanked: 2958 times
Hello jl12,i need to clear out Quotemanager of unneeded contracts is it still necessary to run a process for MC9 to reduce database size.
You can delete the contracts that you no longer need using the QuoteManager. Then run the "reduce database size" procedure to clean up the databases files.
-
Henry MultiСharts
- Posts: 9165
- Joined: Aug 25 2011
- Has thanked: 1264 times
- Been thanked: 2958 times
Hello momentum,Volume Delta:
Improving the information on Volume Delta is great but you are missing the most important info: Comparing the number of contracts traded at the ASK versus the number of contracts traded at the BID rather than comparing volumes at the same price, See the link.
http://www.MD.com/blog/2013/07 ... imbalance/
This has PROVEN to be the correct way of looking at the order flow.
Can this be implemented in V9?
At the moment we do not add any new functionality to MultiCharts 9.0. We are polishing the existing features and fix the known issues. You may want to submit this feature request to the Project Management of our web site so other users can vote for it: https://www.multicharts.com/pm/
-
Henry MultiСharts
- Posts: 9165
- Joined: Aug 25 2011
- Has thanked: 1264 times
- Been thanked: 2958 times
Jad, we'll keep an eye on that and try to improve it when time permits.The alignment is completely irrelevant.
The Line with the strike-through originally said:
"this issue is no longer targeted for Multicharts 9.0 Beta 1"
That strike through it implies that the decision (i.e. to no longer include it in the Beta) has been reversed and it will again be included in it. Even more so when the previous entry remained without a strike-through suggesting that it (the June 05 entry) is again in force.
If you wanted clarity, it is the Jun 05 entry that should have been struck-through and the Oct 02 entry left clear.
-
Smoky
- Posts: 526
- Joined: Dec 03 2010
- Location: Thailand
- Has thanked: 99 times
- Been thanked: 125 times
Great job on LMAX disconnection, here you'll find a small video to show you how MC 9 reconnect rapidly ! Many thanks
http://we.tl/V5u2xVg8KK
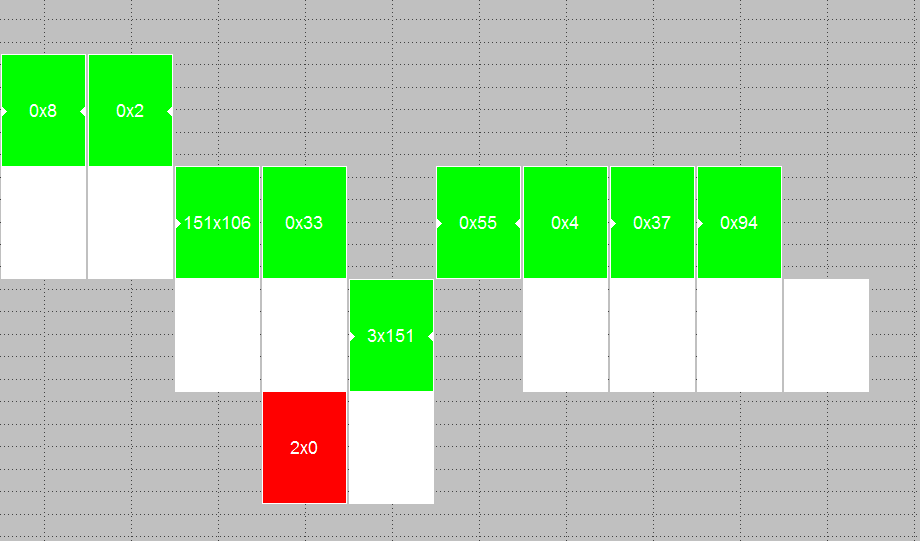
Now we can works with disconnections, my study must know broker status line (for erase pendings orders when disconnect, and sending close all on reconnect) here you'find picture, HAC is my first stategy buy order, after sending this order, broker link is off, and pending pyramids orders are sending on reconnect ! P1 order would be clear from my stategy on event disconnect link.
on reconnect event my stategy choose to close all open position, backfill datas or not, wait some logic to trade again ...

want my stategy to know informations on this popup, with hight time resolution.


little bug in buying power : I'm long 100 contrats I win X dollars, I want to reverse and be short 5 contracts, orders is rejected for buying power reason !
first you do close my long position and then compute buying power for my short order, otherwise I never be short, with Lmax, reverse long/short/long stategy use only 1 commission on reverse orders
http://we.tl/V5u2xVg8KK
Now we can works with disconnections, my study must know broker status line (for erase pendings orders when disconnect, and sending close all on reconnect) here you'find picture, HAC is my first stategy buy order, after sending this order, broker link is off, and pending pyramids orders are sending on reconnect ! P1 order would be clear from my stategy on event disconnect link.
on reconnect event my stategy choose to close all open position, backfill datas or not, wait some logic to trade again ...

want my stategy to know informations on this popup, with hight time resolution.


little bug in buying power : I'm long 100 contrats I win X dollars, I want to reverse and be short 5 contracts, orders is rejected for buying power reason !
first you do close my long position and then compute buying power for my short order, otherwise I never be short, with Lmax, reverse long/short/long stategy use only 1 commission on reverse orders
-
Henry MultiСharts
- Posts: 9165
- Joined: Aug 25 2011
- Has thanked: 1264 times
- Been thanked: 2958 times
Thank you for your feedback.Great job on LMAX disconnection, here you'll find a small video to show you how MC 9 reconnect rapidly ! Many thanks
There is no prebuilt way to get this info into the strategy code. You should be able to get this information from LMAXServerHost_NET_Trace.txt log file using an external library.want my stategy to know informations on this popup, with hight time resolution.
This message comes from LMAX. Please contact your broker directly regarding this inquiry.little bug in buying power : I'm long 100 contrats I win X dollars, I want to reverse and be short 5 contracts, orders is rejected for buying power reason ! first you do close my long position and then compute buying power for my short order, otherwise I never be short, with Lmax, reverse long/short/long stategy use only 1 commission on reverse orders
-
Smoky
- Posts: 526
- Joined: Dec 03 2010
- Location: Thailand
- Has thanked: 99 times
- Been thanked: 125 times
I prefer wait 9.1 beta 1There is no prebuilt way to get this info into the strategy code. You should be able to get this information from LMAXServerHost_NET_Trace.txt log file using an external library.
MC 512 : Adding a function for reading the status of an order on the broker server
-
Henry MultiСharts
- Posts: 9165
- Joined: Aug 25 2011
- Has thanked: 1264 times
- Been thanked: 2958 times