Is it Bullish or Bearish…?
The words “bullish” and “bearish” are frequently used to describe the price behavior of financial instruments. However, what exactly do they mean? This paper offers precise definitions to classify whether a financial instrument is currently “bullish” or “bearish,” as well as providing classifications for price activity that is not outright “bullish” or “bearish.” In short, we have found that all price action can be categorized into six phases that describe the complete cycle of markets. This insight can be usefully applied to any financial instrument in any time frame. Although the principles of this paper will be illustrated with daily bars, the concepts can be utilized by analysts, traders or investors on intraday data, daily, weekly or any time frames on commodities, stocks or indices or in fact any financial instrument subject to market forces.
The ability to precisely categorize all price activity into six phases enhances the ability of the analyst, trader or investor to assess the quality of the price structure of the examined instrument. Categorizing price with specific moving averages further allows statistical analysis of the price structure. Additionally, this allows the analyst or user to compare the quality of different instruments using specific criteria, enhancing objectivity and reducing subjectivity. Lastly, but perhaps most importantly, it is a guide for how money can be deployed in the markets. For example, the core principles of phase analysis can be used in constructing trading systems or in adjusting capital exposure in an instrument according to its phase. The blueprint of phase analysis will demonstrate the need and practice of applied technical analysis to determine and uncover market trends for successful decision making.
“Bullish” is shorthand for upward price action. However, not all upward price action is indicative of further trend. To be able to determine that upward price action is bullish, that price action needs to be viewed in the context of what has preceded the current price action. By comparing current price action to recent price action and longer term price action, we can classify current prices into specific phases, thus offering an objective definition of price phase analysis.
There are a number of ways to determine the context preceding the current price action. For the sake of simplicity, uniformity and availability, we use moving averages. Moving averages offer smoothing, which evens out the variability of short term price movement. They are also useful as comparative tools, where a shorter term moving average is compared to one of a longer length. This comparative feature means price can be rated to both recent as well as longer term averages, meaning current price can be rated in the context of recent as well as long term price. Most importantly, the slope (direction) of a moving average is an excellent tool for both trend and price phase analysis.
Arithmetically, a series of higher highs and higher lows translates into a moving average that will slope upward, and as price action continues over time, this will result in the longer term moving average sloping upward. Using daily price data, we use the 50 period simple moving average, which is ten weeks of price action (or most of a quarterly earnings reporting cycle). This is sufficiently responsive to reflect the changing dynamics of price behavior without being unduly influenced by short term swings. Next, we incorporate the 200 period simple moving average, which represents 40 weeks, (just over three quarters) which captures the longer-term dynamic of changing price behavior. These two commonly used indicators are institutional “rudders,” demonstrating distinct patterns of price behavior.
MultiCharts is consistently recognized for its ease of use and library of tools for the trader. As an author, educator and trainer in technical analysis for over 3 decades we have chosen MultiCharts as our go-to platform for our firm and clients. Many of the indicators used in the following charts can be found in the insert study (indicator) area of the program.

To summarize, we define current as now and prices immediately preceding now, recent as the structure embodied in the 50 period simple moving average and long term as the structure captured by the 200 period simple moving average.
Putting these parts together leads to precise, specific definitions of price action into six phases. We will describe these phases in the typical sequential order of a cycle.
Phase Descriptions
Our descriptions will start with the beginning of the phase cycle. This can be compared to the movements that occur in a bell curve. We start with the buy side and cycle to the sell side. For simplicity, we will abbreviate period moving average to PMA.
Recovery Phase
Close > 50 PMA
Close < 200 PMA
50 PMA < 200 PMA
The Recovery Phase begins with the close of current price above the 50 PMA but the close of price is less than 200 PMA and the relationship of the 50 PMA is less than the 200 PMA. In this price structure, recent and longer term price is weak but the current price is sufficiently strong enough to have overcome the recent weakness. In this phase, there frequently are no new lows in the price channel and the 50 PMA is losing (or has lost) its downward slope.
Accumulation Phase
Close > 50 PMA
Close > 200 PMA
50 PMA < 200 PMA
As price begins to stabilize or improve, we now have the close of current price above both the 50 PMA and the 200 PMA but the relationship of the 50 PMA is still less than the 200 PMA. This defines the Accumulation Phase. In this phase, current price is sufficiently strong to be above recent price and longer term price but the recent price structure has been weak relative to the longer term price structure.
Bullish Phase
Close > 50 PMA
Close > 200 PMA
50 PMA > 200 PMA
The characteristic of price activity is at the highest level of positive phase analysis. I liken it to going into battle with a full team of soldiers behind you, yielding your best chance of success. We now have the current close greater than the 50 PMA and the 200 PMA but most importantly the relationship of the 50 PMA is greater than the 200 PMA.
With this precise definition in place, the analyst, trader or investor can then further examine the quality of instruments in a Bullish Phase. The characteristics of the highest quality Bullish Phase are; 1) a series of higher highs (coincident with trend initiation or continuation) combined with 2) an upward sloping 50 PMA which is above 3) an upward sloping 200 PMA (both of which lag, but define this Phase). Above all, continued new highs confirm the uptrend as well as lead the 50 PMA and 200 PMA to continue up.

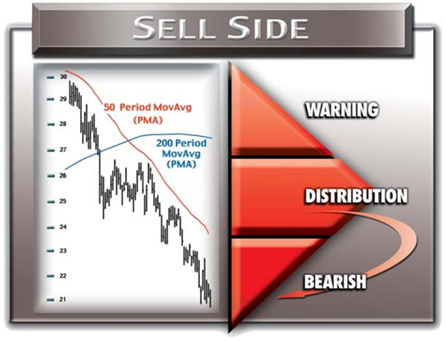
Warning Phase
Close < 50 PMA
Close > 200 PMA
50 PMA > 200 PMA
The Warning Phase is similar to the top of the bell curve. We now have our current close less than the 50 PMA but we still have a positive close greater than the 200 PMA and the relationship of the 50 PMA is greater than the 200 PMA. In this price configuration, current price is weaker than recent prices but the price structure historically has been relatively strong. Price below a downward sloping 50 PMA is a more severe warning than if the 50 PMA is still upward.
Distribution Phase
Close < 50 PMA
Close < 200 PMA
50 PMA > 200 PMA
As price begins to weaken or decline, we now have the current close of price below both the 50 PMA and the 200 PMA but the relationship of the 50 PMA is still greater than the 200 PMA. In the Distribution Phase, the 50 PMA is still above the 200 PMA, which means that although price is weaker than both, there was sufficient recent action high enough for the 50 PMA to still be above the longer term average. The slope of the 200 PMA is losing shape.
Bearish Phase
Close < 50 PMA
Close < 200 PMA
50 PMA < 200 PMA
The characteristic of price activity is now at the lowest level of negative phase analysis. We now have the current close less than the 50 PMA and the 200 PMA but most importantly the relationship of the 50 PMA is less than the 200 PMA.
With this precise definition in place, the analyst, trader or investor can then further examine the quality of instruments in a Bearish Phase. The characteristics of the Bearish Phase are; 1) a series of lower lows combined with 2) a downward sloping 50 PMA which is below 3) a downward sloping 200 PMA (both of which lag, but define this Phase).
The Six Phases of the Diamond
The Diamond Methodology aids us in analyzing price behavior as it changes over time. Markets will cycle between bursts of intense price activity and periods of stability. This natural flow of expansion and contraction of price cycles through the six phases. The insights the Diamond provides act as a compass for both the trader and investor in determining price strength or weakness of any financial instrument that can be traded. The Diamond is broken into two equal and distinct sections. The left side of the Diamond is the “Buy Side” and the right side is the “Sell Side.” There are six phases of price behavior in the Diamond: two clearly trending (Bullish and Bearish) and four where the trend is less evident, where it could be ending or beginning. The two phases where there is sharpest price movement over time are called “Bullish Phase” for the uptrend and “Bearish Phase” for the down trend. If the market has exhibited an expansion of trend over time, the likelihood of a pullback should unfold. The Warning Phase in an uptrend and the Recovery Phase in a downtrend might be signaling the start of what could be the beginning of a counter trend move. In the progression of market cycles, markets move in a bell curve manner. We begin to see buying interest followed by acceleration in price and volume. Price may then plateau; sellers step in and begin liquidating long positions. This sets the stage for an increase in selling activity, and then price will decline until it establishes a floor for support. Once a base is built, price levels out again, and the cycle of price activity repeats itself.
TREND Weight
Below are the components of trend which we assign a value to determine the weight as it relates to trend characteristics. The prime scale is from 0 – 100. There will be times when we see pullbacks and pull-ups in trend. When this unfolds the scale moves to a minus value from 0 to (–30). Financial instruments (like forex) not having a volume component will have a scale from 0 – 85.
Set the positive weight (e.g. combination of all positive criteria)
if Cond21 then = Weight + 15; {UpSlope 50 PMA}
if Cond23 then = Weight + 10; {UpSlope 200 PMA}
if Cond25 then = Weight + 10; {Stochastic SlowD 55 > 50}
if Cond11 then = Weight + 10; {Recovery Phase}
if Cond12 then = Weight + 20; {Accumulation Phase }
if Cond13 then = Weight + 30; {Bullish Phase }
if Cond14 then = Weight – 10; {Warning Phase}
if Cond15 then = Weight – 20; {Distribution Phase}
if Cond16 then = Weight – 30; {Bearish Phase}
if Cond27 then = Weight + 10; {RSI(Close,55)> 50; }
if Cond28 then = Weight + 15; {VolumeOsc > 0}
if Cond31 then = Weight + 10; {Momentum 55 > 0}
Set the positive weight (e.g. combination of all negative criteria)
if Cond22 then = Weight + 15; {DownSlope 50 PMA}
if Cond24 then = Weight + 10; {DownSlope 200 PMA}
if Cond26 then = Weight + 10; {Stochastic SlowD 55 < 50}
if Cond14 then = Weight + 10; {Warning Phase}
if Cond15 then = Weight + 20; {Distribution Phase }
if Cond16 then = Weight + 30; {Bearish Phase }
if Cond11 then = Weight – 10; {Recovery Phase}
if Cond12 then = Weight – 20; {Accumulation Phase}
if Cond13 then = Weight – 30; {Bullish Phase}
if Cond29 then = Weight + 10; {RSI(Close,55)> 50; }
if Cond30 then = Weight + 15; {VolumeOsc > 0}
if Cond32 then = Weight + 10; {Momentum 55 < 0}
Volume Oscillator
One more element of the analysis is the volume study. The reason we analyze volume is that, as prices advances, we want confirmation that there are increasing transactions at higher prices-more transactions at higher prices confirms for us that demand is outstripping supply. Ideally, we want to see these increases in volume as prices surge (when we are getting higher highs), and decreases in volume as the prices consolidate after the surges.
To analyze volume, we combine a 5 & 21 period XMA volume oscillator. The volume oscillator is simply a moving average of volume. We use a moving average of volume to smooth out the spikes of any individual day—this is to reduce the potential for being misled by any one data point. If the 5 period XMA of volume is surging relative to the 21 period XMA, this suggests price and volume expansion, a positive., oscillator turns green The blue oscillator bar tells the trader volume has doubled from the prior bar. Below we see high volume breaks of resistance followed by pullbacks with an absence of volume (oscillator turns red) this is a plus. Point A displays absence of volume near top should be looked at as possible warning.

Pulling it Together
On August 8, 2012 BAC showed signs of constructive phase analysis. As price made a higher low and the slope of the 200 pma turning up this started to display signs of a trend change. Looking at the chart below most all components of trend were positive and price moved into the Bullish for 3 consecutive periods. Summing the weight of the trend our value was 85. The missing link to see a trend weight of 100 was the volume oscillator which has a trend weight of 15. We like to see volume advancing on resistance breaks or new highs. When accessing trend and phase analysis we need not see all components of trend positive or a trend weight of 100. Much of this depends on the trader or investor and how they quantify their risk.
if Cond21 then = Weight + 15; {UpSlope 50 PMA}
if Cond23 then = Weight + 10; {UpSlope 200 PMA}
if Cond25 then = Weight + 10; {Stochastic SlowD 55 > 50}
if Cond13 then = Weight + 30; {Bullish Phase }
if Cond27 then = Weight + 10; {RSI(Close,55)> 50; }
if Cond31 then = Weight + 10; {Momentum 55 > 0}
85
How to Use?
Discussion Opportunity we all have different views of how and when to place a trade I could only provide a general perspective. Phase analysis delivers the trader or investor a compass where price currently resides over time. That time or look back could be from intra-day to weekly chart analysis. Quantifying the weight of the trend based on the indicators we have chosen screens the trend producing a scale value from 0 no trend to 100 where all components of trend exist. Observing the conditions of the weight you notice Bullish/Bearish, slope and volume make-up the highest values. All these indicators look at price through a dissimilar lens.
-
50 PMA & 200 PMA – most fundamental traders use these 2 averages most important the slope
-
MarketPhase – you might consider laddering into a position or less size depending on the phase
-
Weight – displays supply & demand features combined with current price trends as a value from 0 – 100
-
RSI – summing the closes over 55 bars if above 50 the close is advancing
-
SlowD Stochastic – where the current price resides in relationship to the highest high & lowest low the past 55 bars (and a moving average component) if SlowD is at 80, basically it’s in the 80 percentile of the 55 bar range.
-
Momentum – this looks at the current close compared to the close 55 bars ago if the value is 1.37 that tells us todays close is 1.37 points higher than the close 55 bars ago
-
VolumeOsc – the volume oscillator helps us in determining supply and demand characteristics for the current time frame of the financial instrument. If price is rising and demand is outstripping supply our oscillator will be green. Post an advance we like to see an absence of volume. This suggests traders are unwilling to sell as price declines. The opposite holds true, if volume surges as price declines traders are selling.
See above chart of BAC. Since August 2012 the past 12 months this issue has advanced from the mid-7s to the mid-14s. Nice move for any financial instrument. From a pure technical vantage current price price has a trend weight of 85 very positive yet traders are unwilling to bid prices higher which is the 15 point (volume oscillator component) not having this trend weight at 100. Looking at the advance over the past year price occupied the BullishPhase 90% of the time moving into the WarningPhase 5 times but 4 of them had upward sloping 50 PMAs a plus. It would appear we are in a mature BullishPhase and a pullback would be warranted. Looking at the current market environment (August, 2013) BAC price is in the BullishPhase the past 36 periods with a trend weight of 85. Moving forward a break above 15 with volume would be a real plus and 14 looks like a key support area with the 50 pma residing there. A break of 14 on volume could see a move towards the 12ish area.
A study we completed on the Dow Jones Industrial Average that spanned 75 years of daily data. There were two dominant phase where price resided. Clearly the BullishPhase controlled price action with 44% and the BearishPhase 19%. Almost two-thirds of all price activity was distributed between these two phases.
TRENDadvisor.com and MultiCharts offers a virtually unlimited list of capabilities for traders and institutions. Please contact Chuck Dukas at info@TRENDadvisor.com or call (704) 385-7000 if you would like more information.
MultiCharts thanks Chuck Dukas for this extremely helpful educational material.
We hope that you find this material helpful and valuable.
In case you have any questions regarding MultiCharts features and functionality or special licensing terms please do not hesitate contact us support@multicharts.com
It would be great if technical indicators and fundamentals worked in a market where the only reason to buy is an assurance that the Fed is going to continue to print $85B / month. When the large majority of the upward movement of the past four years has occurred during the low volume overnight session, one is forgiven for skepticism. In fact, light volume levitation has been the signature of the past four years…as has miraculous, massive buying at critical breakdown points.
Not to say that such tools are not valuable: just that they are not dispositive. In the end, you better be buying and selling purely based on price action and not indicators.