How to create the best point of view on the markets
Gaining the best perspective on the markets is every trader’s goal. Regardless of the indicators they choose to add to any chart, a trader is missing important information about the market if they aren’t looking at trends from multiple time frames. When a Trader looks at a trading instrument across more than one time frame, they are able to gather vital information, and construct an informed trading outlook. Traders should be analyzing information from both a short term and long term chart to capitalize on the different points of view. When a trader understands how best to utilize each time frame to build a strong trading assumption they are increasing their odds of success.
Short and Long Haul
As part of the information gathering process, I believe traders should include multiple time frames in order to gain the clearest picture. Charts with a long term and short term time frame provide the trader with both a detailed and broad view of that market. These multiple perspectives can then be combined to more accurately gage the market trend.
Each time frame provides a specific function
Each time frame chart provides a different perspective, and serves a specific function. Since both long term and short term charts can provide different information, a trader must understand what information is best to gather from each time frame.
Time frames ranging from the 60 minute and 5 minute are what I recommend as short term. These shorter time frames provide an opportunity for a trader to view the market from a perspective that is zoomed in. The shorter term time frames can help traders interpret the immediate action, and determine momentum, thus why these short term time frames are most beneficial to determine entry levels for trades.
A long term chart such as a daily, weekly or monthly chart provides a broad picture of the market. This long-term perspective provides the information a trader needs to determine a trend. Since I believe traders will increase their chances of success when they trade in the direction of the overall trend, the long term time frames will be very important. The longer the time frame, the more professional, institutional and mutual fund traders are paying attention. This means that there is also more money paying attention to key levels of support and resistance, meaning that they are more likely to hold.
For example if the daily or weekly charts are in a strong up trend, then short trades taken off of the 60 or 5min charts have less of a chance of success. Day traders often see a 5min chart snap back and wonder what happened. If they had looked at a 60min chart they may have seen that the retracement in trend on the 5min chart was simply the 5mi and 60 min charts aligning.
Combine Both For The Best Perspective
Traders should review at least one short term time frame, and one long term timeframe for each trading instrument they are considering. A trader who only looks at a 5 minute chart and then places a trade may be missing some key information that could prevent the trade from being successful. To use charts from different timeframes most effectively, they need to be analyzed separately and then viewed across the timelines. When a trader combines analysis from a long term chart with a short term chart, this trade is far more likely to be successful.
To illustrate the importance of multiple time frames, let’s work through an example.
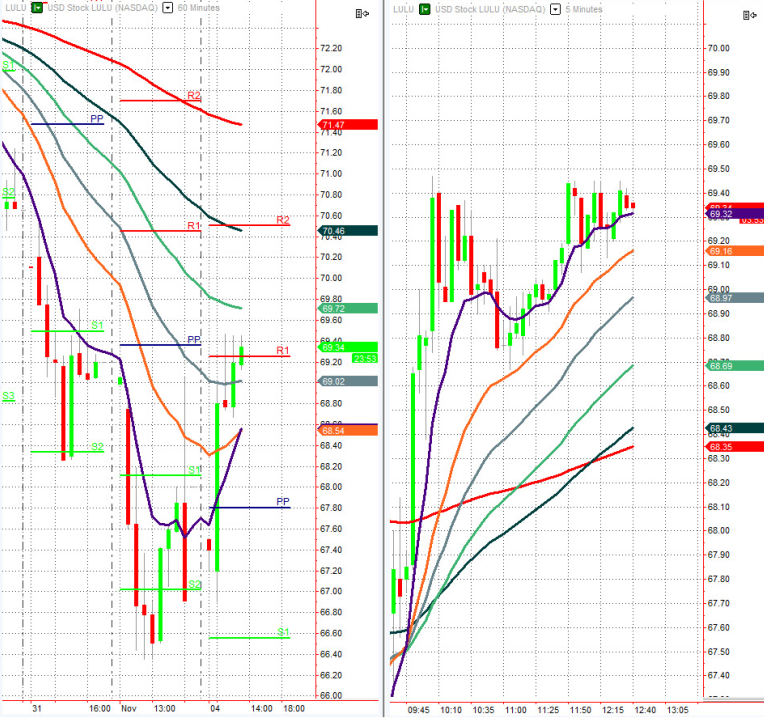
A trader looking at this chart of LULU may think that this is a good trading opportunity. Looking at the 5 minute chart alone, a trader may think this trading instrument is trending upwards.
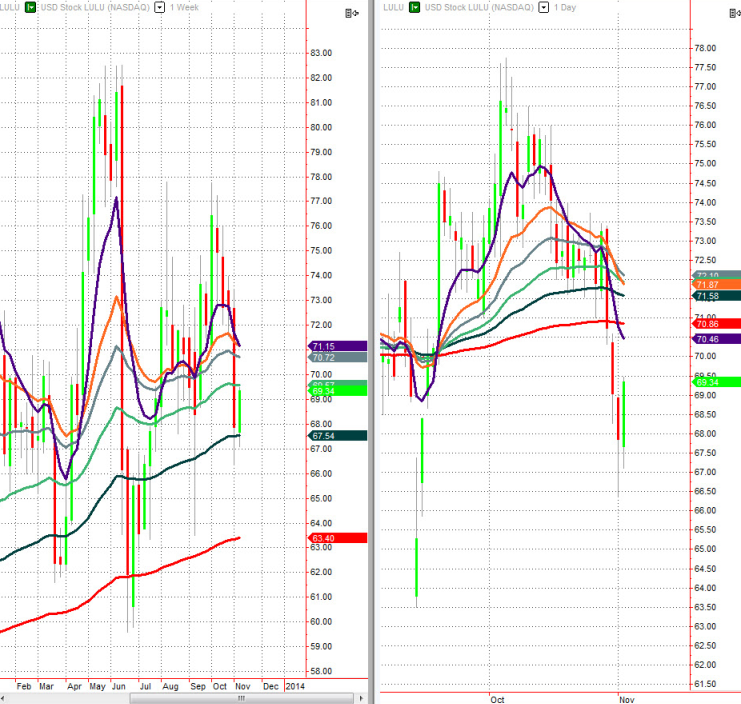
But as a trader adds a longer term timeframe, they would realize that this trade is less likely to move in their favor. As illustrated on this longer term charts, this trading instrument is actually moving down.
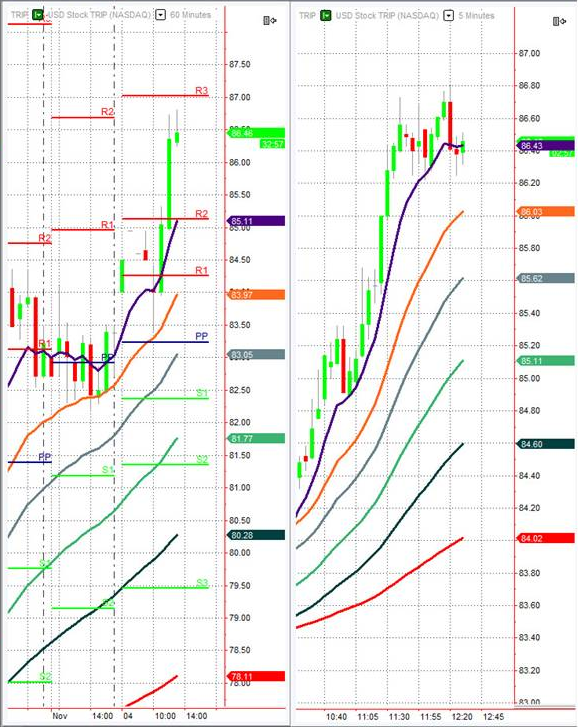
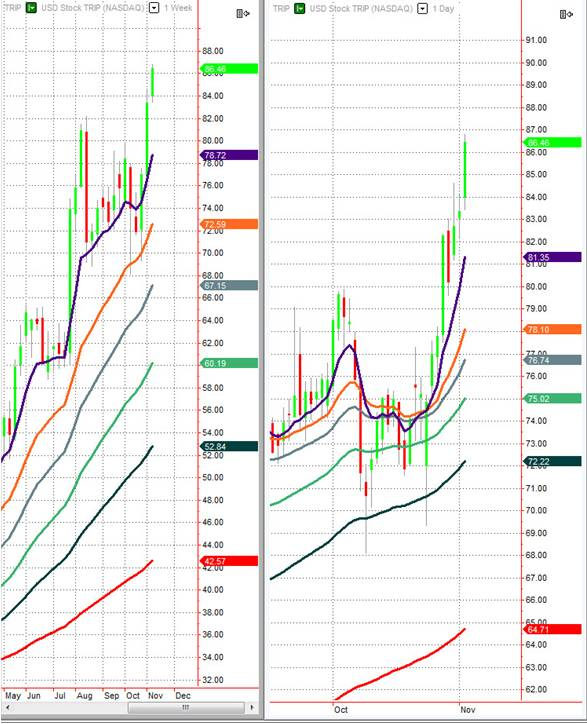
Whereas, in the TRIP chart below, a trader can put more weight behind their trade assumption when they are able to verify that a trend is in fact apparent on both the long term and short term charts.
The TRIP trade has a higher probability of success. All of timeframes are moving in the same direction.
Every trader is always looking for the trading edge, the best point of view. In order to gather the best evidence to enter trades, I believe Traders should be aware of the multiple perspectives that different time frames can provide. Multiple time frames can mean all of the difference and shouldn’t be overlooked.
Sarah Potter trades both futures and options using simple technical analysis to place ‘set it and forget it’ trades. She writes a popular blog www.shecantrade.com where she shares real information for traders of all abilities. Sarah has a unique ability to explain the world of trading in a clear and concise manner that traders new and experienced appreciate. Her work has been featured in numerous publications including Active Trader, SFO Magazine, Canadian Investing Magazine and more. Her trading idea service, The CornerLOT has one of the best performance track records of many trading newsletters available to retail traders.
MultiCharts thanks Sarah Potter for this extremely helpful educational material.
We hope that you find it helpful and valuable.
In case you have any questions regarding MultiCharts features and functionality or special licensing terms please do not hesitate contact us support@multicharts.com


