Two Cumulative Delta Volume Analysis Patterns Every Scalper Needs to Know
Scalpers rely on their ability to identify high probability setups where they can enter and exit the markets quickly. Unlike intraday traders, scalpers may be in and out of more than eight to ten trades in a single day. In this article, I will show you two patterns that every scalper should know. Both patterns use the new Cumulative Delta Volume Analysis charting capability in MultiCharts. These two patterns are easily recognizable on the live edge of the market and give important clues as to where price will go next.
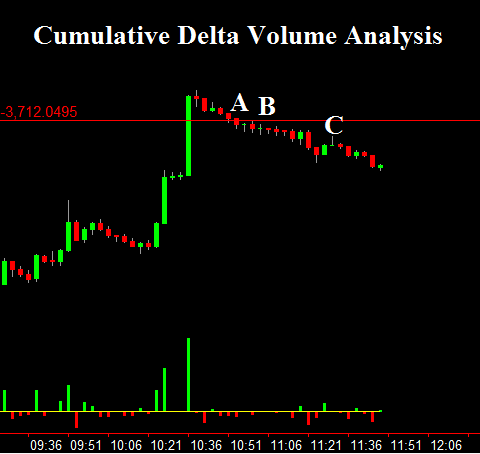
First, every scalper knows how disastrous a congestion area can be. In fact, most losses occur during congestion periods, and markets love congestion. By using Cumulative Delta Volume Analysis, scalpers can identify the direction which price will more than likely break out. In Figure 1: Euro 3 Minute Chart, price has made a lower high at Point A. Then at Points B and C, price came back to test the lower high. Does the trader wait for a breakout of the congestion area or enter a short position based on the lower high?
Figure 1: Euro 3 Minute Chart
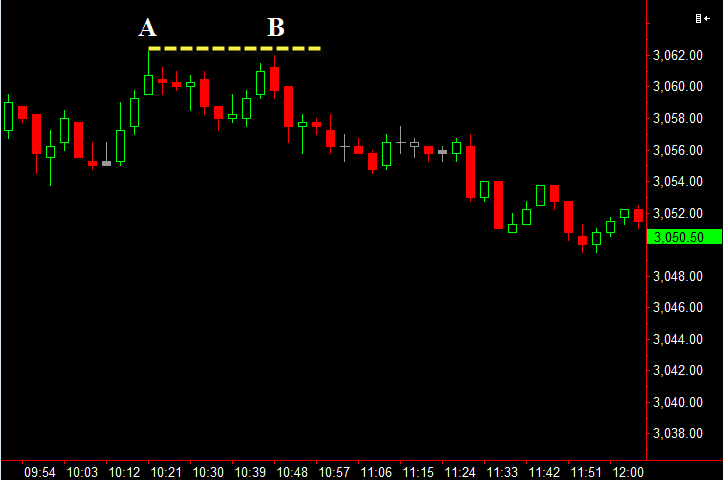
Using the new Cumulative Delta Volume Analysis charting option in MultiCharts, the trader can enter at either Point B (very low risk) or at Point C because the Cumulative Delta Volume Analysis shows that buyers are not interested in taking price up. In Figure 2: Cumulative Delta Volume Analysis – Euro 3 Minute Chart, when price tested the high at Point A, buyers were non-existent in the market.
Figure 2: Cumulative Delta Volume Analysis – Euro 3 Minute Chart
Since buyers were not interested in taking price up (also known as lifting the price), then sellers were able to easily take prices lower. This is a simple pattern that allows scalpers to identify if the congestion breakout will be to the up side or to the down side.
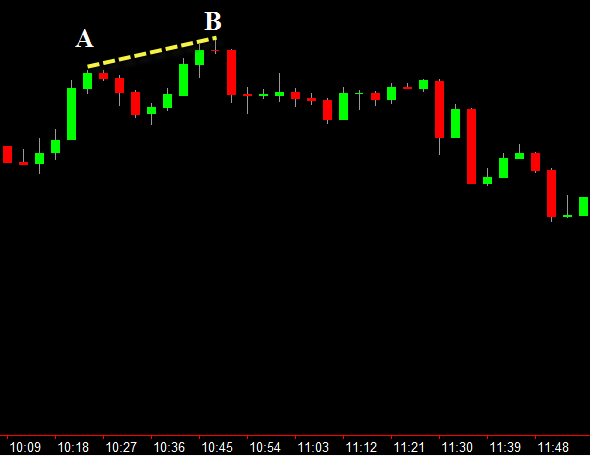
Another pattern that can be used, which confuses most traders when using typical volume bars, is the one formed by “No Progress” bars. In Figure 3: NASDAQ 3 Minute Chart, at Point A, price made a high, and then at Point B, price went back to retest the high. Will price continue up or will it reverse?
Figure 3: NASDAQ 3 Minute Chart
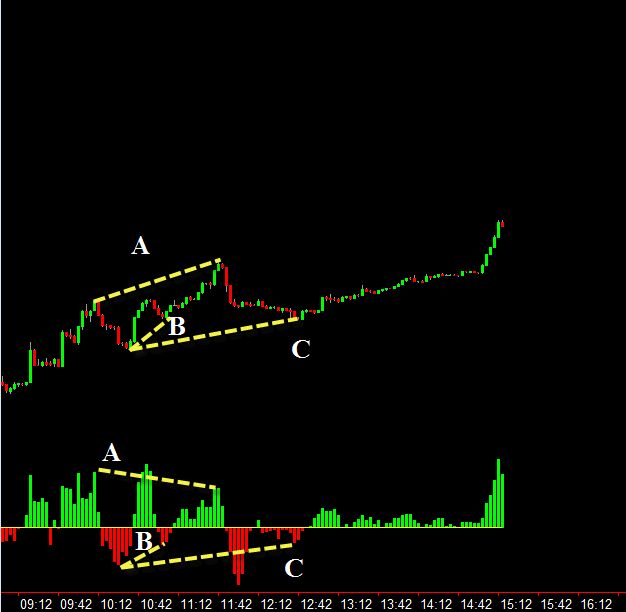
The clues are actually in the Cumulative Delta Volume Analysis chart (Figure 4). As you can see, at Point A, the Cumulative Delta Volume Analysis chart made a high and at Point B, the Cumulative Delta made a higher high. In other words, more buyers came into the market at Point B, but price did not make a higher high (when compared to Point A). This shows a “lack of progress by the buyers”, also known as a “no progress” bar. Sellers see this as buying weakness and will take price lower.
Figure 4: Cumulative Delta Volume Analysis, NASDAQ 3 Minute Chart
Now, let’s combine the two patterns to see how it played out on the live edge on a more volatile chart.
Using a three minute chart on Gold (which is actually a long time period for scalpers), in Figure 5: Gold Three Minute Price Chart, price made a lower high, yet in Figure 6: Cumulative Delta Volume Analysis Three Minute Chart, the cumulative delta was showing more buyers were lifting the bid at that point. In other words, although buyers were trying to lift price, they failed because price did not make a higher high. This is also confirmed by the THD Momentum indicator, which clearly showed divergence in the momentum on the cumulative delta.
Figure 5: Gold Three Minute Price Chart
Figure 6: Cumulative Delta Volume Analysis Three Minute Chart
Then in Figure 5 at Point B. price made a low and came back to test the low. However, in Figure 6 at Point B, the cumulative delta showed that sellers were not responding. In other words, as price was coming back to the previous low, buyers were entering the market (not sellers). Again, this is confirmed with the momentum divergence showing a lack of momentum as price was coming back to test the low.
Finally, at Point C in Figure 5, price made a lower low. Again, Figure 6 at Point C clearly shows that sellers were not lowering price. In fact, just the opposite was happening — buyers were buying the low (professionals coming in at the low lifting price). This is confirmed with the THD Momentum indicator showing a lack of selling momentum.
I identifying these trade setups using Cumulative Delta Volume Analysis allows scalpers to easily identify when they are trading with the “big money” and, thereby, increase their probability of having a positive trade outcome.
Additionally, since MultiCharts has made the Cumulative Delta Volume Analysis a charting type, most indicators that work on price will also work on the Cumulative Delta chart type, as well. For example, the TradersHelpDesk ADX (THD ADX)which is a core indicator in our trading methodology works on the Cumulative Delta chart type Just about every trade setup that I take is identified by the THD ADX indicator, which acts as a predictive indicator as to where price will go. The THD ADX can also be inserted on the Cumulative Delta Volume Analysis chart to identify when the bid/ask data is overextended.
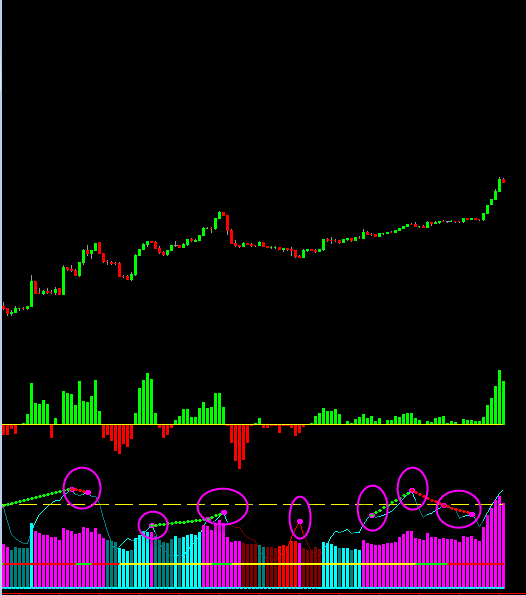
For example, in Figure 7: THD ADX on Cumulative Delta, at each of the magenta dots (circled), the trader would know to expect a pullback by either buyers or sellers (in other words, expect traders to take profits at these points). By analyzing the ADX on the Cumulative Delta chart, scalpers have the added benefit of identifying their best entries with the lowest risk.
Figure 7: THD ADX on Cumulative Delta
Previously Cumulative Delta Volume Analysis was mainly available to only the “Professionals” while personal traders struggled to understand the “behind the scenes” scenario using volume bars. MultiCharts is changing this by giving every trader the opportunity to see what is actually going on behind the price bars. MultiCharts allows for connections with multiple brokers, including the ability to connect via the CQG data feed (provided you have an account with either CQG or AmpFutures). Best of all, the data is free (if you have an account with either AmpFutures or CQG) so there are no additional data fees to pay for historical bid/ask data.
To learn more about the Cumulative Delta Volume Analysis and TradersHelpDesk proprietary indicators, visit either the TradersHelpDesk.com or FulcrumTrader.com websites and learn to use these simple, low risk patterns to your advantage.
MultiCharts thanks Gail Mercer for this extremely helpful educational material.
We hope that you find this material helpful and valuable.
In case you have any questions regarding MultiCharts features and functionality or special licensing terms please do not hesitate contact us support@multicharts.com
